
A change of scene; jungles
I have just got back from a short (too short!) trip to Costa Rica. I wasn’t sure what to expect from this world famous eco destination but I decided to bring my camera trap with me on the off chance I would be given permission to set it up and capture something new, for me anyway.
My time was split between two distinct ecosystems, lowland rainforest of the Caribbean slope and dry forest of the Guanacaste/Nicoya peninsular. I stayed in protected areas and reserves so the chances of mammal activity was there, unfortunately I had only two or three days in each place which limited the chances of capturing anything somewhat. Hardly scientific I know but I was curious to see what might be out and about after I was tucked up in bed.
Now I am used to the African bushveld, a dry-ish, semi wooded, semi open grassland environment with a sandy substrate. It is easy to see where animals are frequently passing from trampled vegetation and tracks. Placing camera traps and getting results was not too hard. Costa Rica’s rainforests on the other hand was a challenge. The vegetation was thick, lush and resilient to animal passage and finding tracks in the dense leaf litter was impossible. Costa Rica’s dry forests where just as bad. It was the dry season and the trees had lost all their leaves…big leaves that made a thick carpet on the ground covering any tracks and trails.
Needless to say I did not get too many results but taking my time frame and lack of local knowledge into account it is amazing that I got anything. All the animals were at least new to me so gave me a great buzz.
Of the animals I captured peccaries, a type of pig where the most common in the rainforest followed by crab eating raccoons in the dry coastal forests. I captured 1 agouti, 1 paca, 1 probable grison devouring my camera and the most exciting of all an ocelot. Typically the ocelot was the very first capture on the first night. Staying at the Selva Verde lodge I had the help of the resident guide, Ivan and we placed the camera near to the river. I think he was just as thrilled as I was to get an ocelot despite their being the most common of the neo tropical cats.
I hope you enjoy this short video clip, you can see if you look closely that the ocelot is carrying something in its mouth, prey?
Find that nest!
You’ve got to check out this game: http://nightjar.exeter.ac.uk/story/nightjar_game

Scientists from the University of Exeter are trying to understand camouflage. Specifically, they want to understand how camouflage helps protect animals from being eaten for dinner, and they’re doing this by studying ground nesting birds in South Africa & Zambia.
Like Snapshot Serengeti, these guys use camera traps too, to figure out whose munching on birds and their nests. Unlike Snapshot Serengeti, however, they aren’t asking for help IDing the photos: instead, they’re asking for help figuring out how predators see, and how different types of camouflage work better or worse against predators with different types of vision.
Humans have trichromatic vision, meaning we have three different types of receptors (light sensitive cells in the eye) that can process color: red (longwave), green (mediumwave), and blue (shortwave). Some animals only have two receptor types and can only see one or two colors, whereas other animals have four, allowing them to see wavelengths such as infrared or ultraviolet that are invisible to people. Thus, what camouflages eggs against one predator might not work so well against another predator.
What these researchers have done is create a game that mimics the vision of other predators. So you get to see the world through the eyes of either a genet cat (with dichromatic vision) or a vervet monkey (with trichromatic vision), and “hunt” for birds or their nests in a series of pictures. This helps scientists understand how perception changes among different animals, and how camouflage works against different perception types.
So go check it out! But don’t forget to come back and then help us classify Season 7! We’ll announce its debut on the blog soon!
What we’ve seen so far, cont’d.
Playing with data is one of the many things I love about research. Yes, it is super nerdy. I embrace that.
Last week I shared with you the various critters we’re getting to *see* in the Snapshot Serengeti data. Over 100,000 wildebeest photos! Over 4,000 lions! And the occasional really cool rarity like pangolins

Pangolin!
and rhinos.

Rhino!
But the photographs carry a lot more information than just simply what species was caught in the frame. For example, because the photos all have times recorded, we can see how the Serengeti changes through time.
This graph shows the number of daily pictures of wildebeest and buffalo, and how the daily capture rates change through the seasons. Each set of bars represents a different month, starting in July 2010. Wildebeest are in dark green, buffalo in light green. The y-axis is on a square-root scale, meaning that the top is kind of squished: the difference from 30-40 is smaller than the distance from 0-10. Otherwise, we’d either have to make the graph very very tall, or wouldn’t really be able to see the buffalo counts at all.

Buffalo are captured more-or-less evenly across the different months. But the wildebeest show vast spikes in capture rates during the wet season. These spikes in numbers coincide with the migration, when the vast herds of wildebeest come sweeping through the study area.
Now, the number of photos doesn’t directly transfer into the number of wildebeest in the study area, and these aren’t changes in population size, but instead changes in distribution of the wildebeest. But it’s pretty cool that with something as simple as just the number of photographs, we can see these huge changes that accurately reflect what’s going on in the system.
What we’ve seen so far…
As we prepare to launch Season 7 (yes! it’s coming soon! stay tuned!), I thought I’d share with you some things we’ve seen in seasons 1-6.
Snapshot Serengeti is over a year old now, but the camera survey itself has been going on since 2010; you guys have helped us process three years of pictures to date!
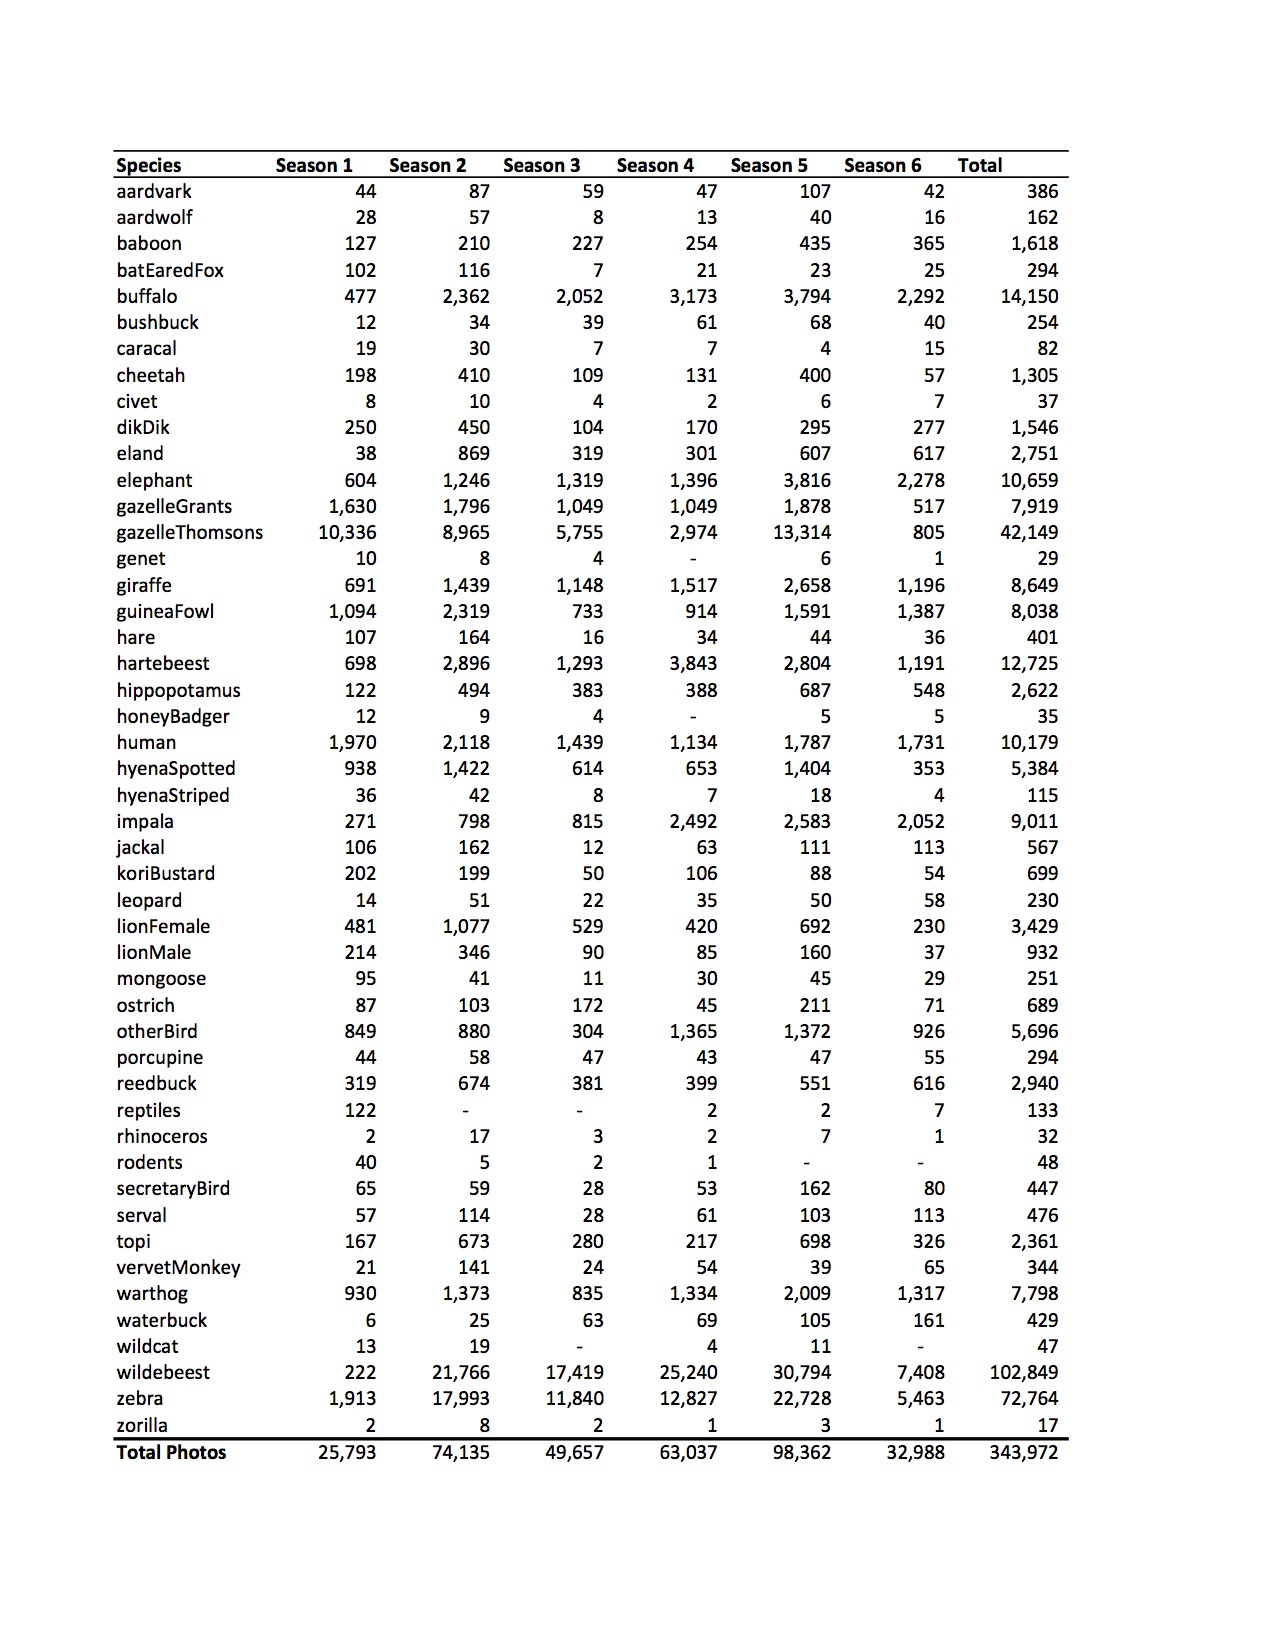
First, of the >1.2 million capture events you’ve looked through, about two-thirds were empty. That’s a lot of pictures of grass!

But about 330,000 photos are of the wildlife we’re trying to study. A *lot* of those photos are of wildebeest. From all the seasons so far, wildebeest made up just over 100,000 photos! That’s nearly a third of all non-empty images altogether.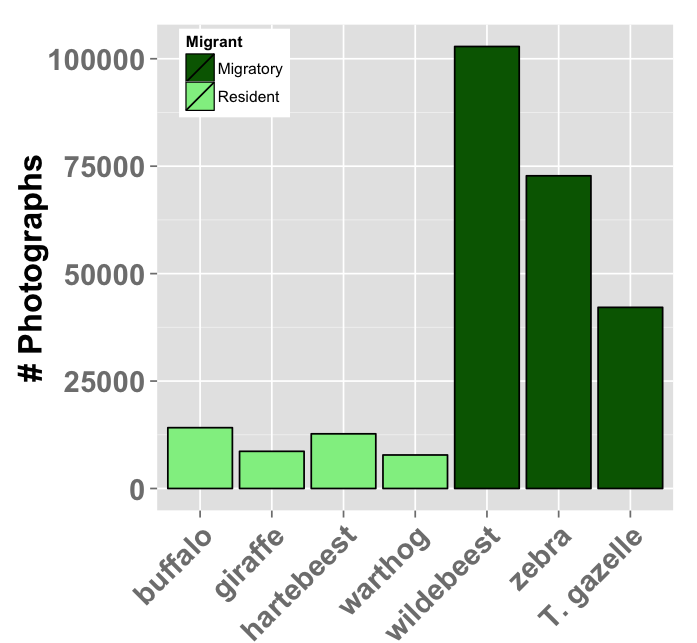
We also get a lot of zebra and gazelle – both of which hang out with the wildebeest as they migrate across the study area. We also see a lot of buffalo, hartebeest, and warthog — all of which lions love to eat.

We also get a surprising number of photos of the large carnivores. Nearly 5,000 hyena photos! And over 4,000 lion photos! (Granted, for lions, many of those photos are of them just lyin’ around.)
Curious what else? Check out the full breakdown below…
Big Cat Wars
I’m in the process of writing up some *really* cool camera trap results from Seasons 1-6, and plan to share them here next week (as soon as I make them pretty). It would never have been possible without your guys’ help. But in the meanwhile, this just aired again on TV, and thought you might enjoy a bit of a break! They talk about the camera traps a bit ~33 minutes in.
A day in the life of a camera
Okay, okay, it’s actually more like 2 months in the life of the camera, but I strung selected images together for site M08, Season 4, “roll 2.”
It’s actually pretty cool. It amazes me just how much information we get on even a single camera. We can see the migration moving through, the grass greening up, and even a spat between lions and hyenas!
My next task will be to string *all* of the images together for the season, but there are >2,000 of them, which my little computer couldn’t quite handle just yet.
The curious case of the giraffe and the oxpecker
As you all ready know Snapshot Serengeti’s thousands of camera-trap images are part of an ongoing study into predator interactions by Ali. There are few projects that use camera-traps as extensively as Snapshot Serengeti and of course Ali has her hands full analysing the bits relevant to her. The cameras work around the clock recording details of daily and nightly life in the Serengeti and do not discern between the stuff Ali does and doesn’t want. That’s why, Ali’s sanity aside, they are such perfect tools. Those same cameras providing Ali’s data could also be the basis of a future ecologist’s research.
One of the most striking asides for me is the case of the giraffe and the oxpeckers.
Oxpeckers are small birds that feed on ticks and other parasites that they glean from the bodies of large mammals. Most usually they are seen riding along on large mammals such as buffalo, wildebeest and giraffe whilst they search their hosts for ticks or open wounds. This in itself is not an unusual occurrence and most of you will have hit the bird /other button with these guys. Much more unusual are the shots of giraffe at night time with these birds using them as roosting spots. There are two species of oxpecker, the red-billed (Buphagus erythrorhynchus) and the yellow-billed (Buphagus africanus) both of which are found in the Serengeti.
According to research carried out by M. Stutterheim and K. Panagis that looked at the roosting habits of both species the red-billed oxpecker roosts in trees but the yellow-billed was often found roosting on their preferred host species. Apparently red-billed oxpeckers feed on a wide range of host species where as yellow-billed oxpeckers are much more picky preferring buffalo and giraffe. It is thought that the habit of roosting at night on their favourite host species is an adaptation to save the birds time looking for the right animal the following day. Given that buffalo and giraffe are prone to walking large distances this is probably very sensible.
From most of the images we have of oxpeckers on giraffe at night it is hard to tell which species they are but there are one or two where you can see the tell-tell yellow bill confirming that they are indeed yellow-billed oxpeckers. The images also show that the birds seem to prefer settling between the hind legs of the giraffe. This must be a nice warm spot in winter and keeps them safe from any nocturnal predators.

Perhaps the behaviour is not so unusual after all but rather little documented. Getting photographic evidence of birds at night on mobile roosts is obviously not easy. Looks like our camera-traps have excelled themselves again.
More accidental video
In processing Seasons 5 and 6, I recently stumbled upon a bunch of video files amongst the stills. You may recall that while we have our cameras set to take still images, every once in a while a camera gets accidentally switched to video mode. Then it takes 10-second (silent) clips. Most of these are “blanks” triggered by grass waving in the wind. But every once in a while, we get ten seconds of animal footage. Here are some from Season 5.
Zebras
Giraffe (peek-a-boo!)
Warthog
And, what do you think this is?
Things are looking up!
I’ve got to echo Margaret’s apology for our sporadic blog posts lately. Things have been a bit hectic for all of us — Dr (!!!) Margaret Kosmala is finishing up her dissertation revisions and moving on to an exciting post-doctoral position at Harvard, our latest addition, Meredith, is finishing up her first semester (finals! ah!), and I’m knee deep in analyses (and snow!).
So,\ please bear with us through the craziness and rest assured that we’ll pick up the blog posts again after the holidays. In the meanwhile, I’ll show you something that got me really excited last week. (Warning: this involves graphs, not cute pictures.)
Last week, I was summarizing some of the Snapshot Serengeti data to present to my committee members. (My committee is the group of faculty members that eventually decide whether my research warrants a PhD, so holding these meetings is always a little nerve-wracking.) As a quick summary, I made this graph of the total number of photographs of the top carnivores. Note that I’m currently only working with data from Seasons 1-3, since we’re having trouble with the timestamps from Seasons 4-6, so the numbers below are about half of what I’ll eventually be able to analyze.
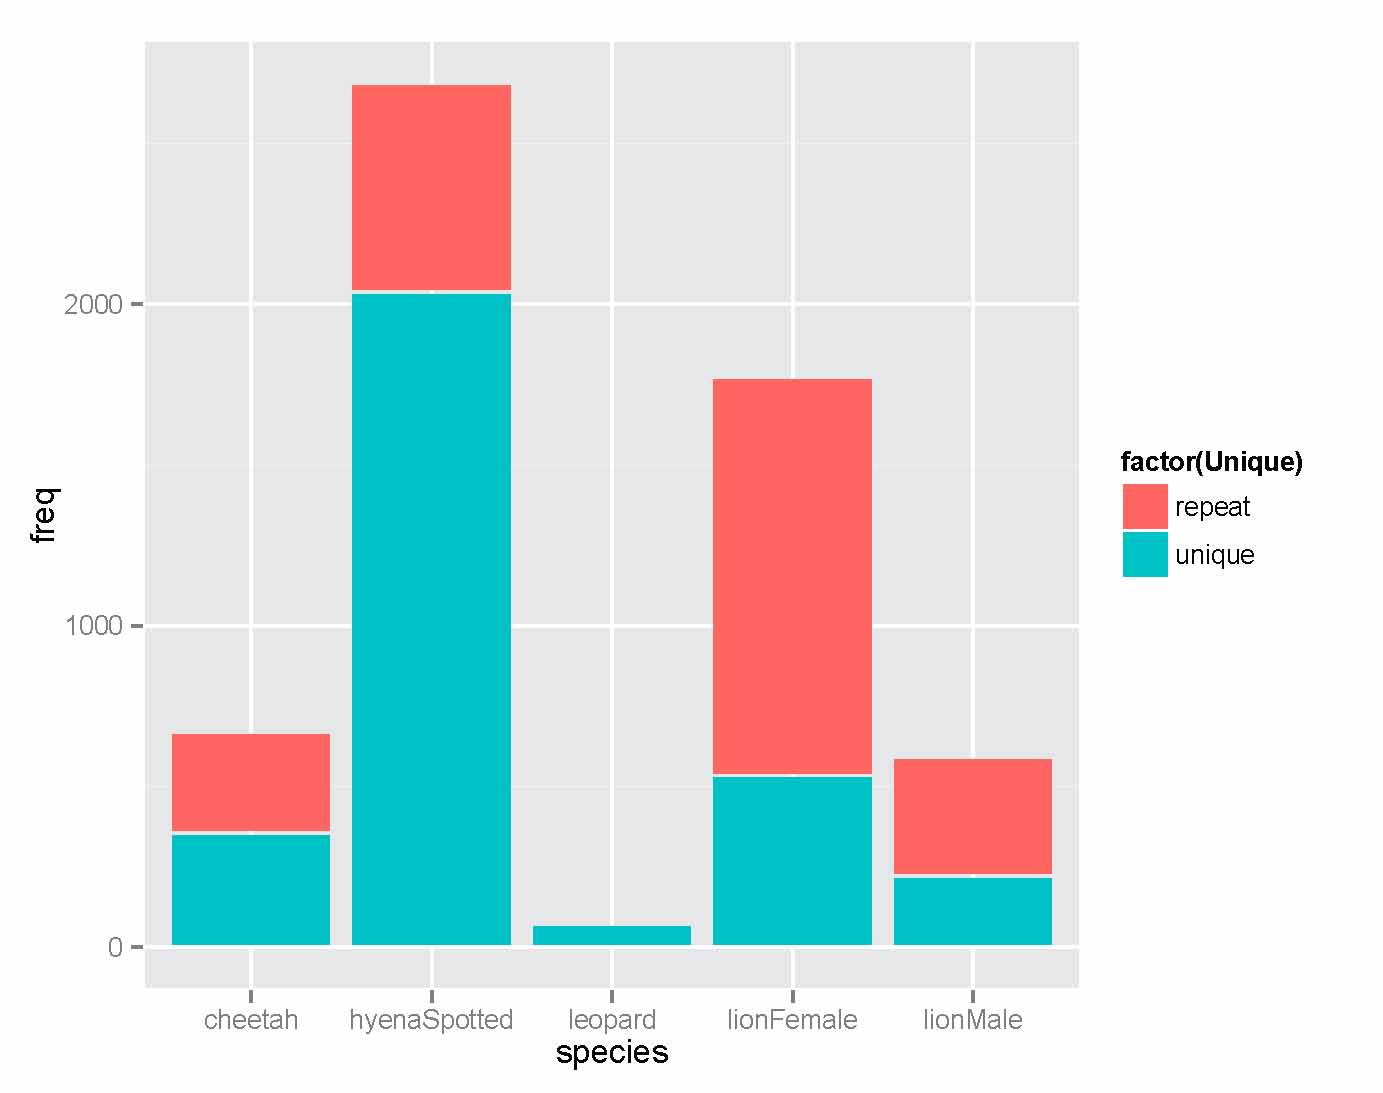
The height of each bar represents the total number of pictures for each species. The color of the bar reflects whether or not a sighting is “unique” or “repeat.” Repeated sightings happen when an animal plops down in front of the camera for a period of time, and we get lots and lots of photos of it. This most likely happens when animals seek out shade to lie in. Notice that lions have wayyyy more repeated sightings percentage-wise than other species. This makes sense — while we do occasionally see cheetahs and hyenas conked out in front of a well-shaded camera, this is a much bigger issue for lions.
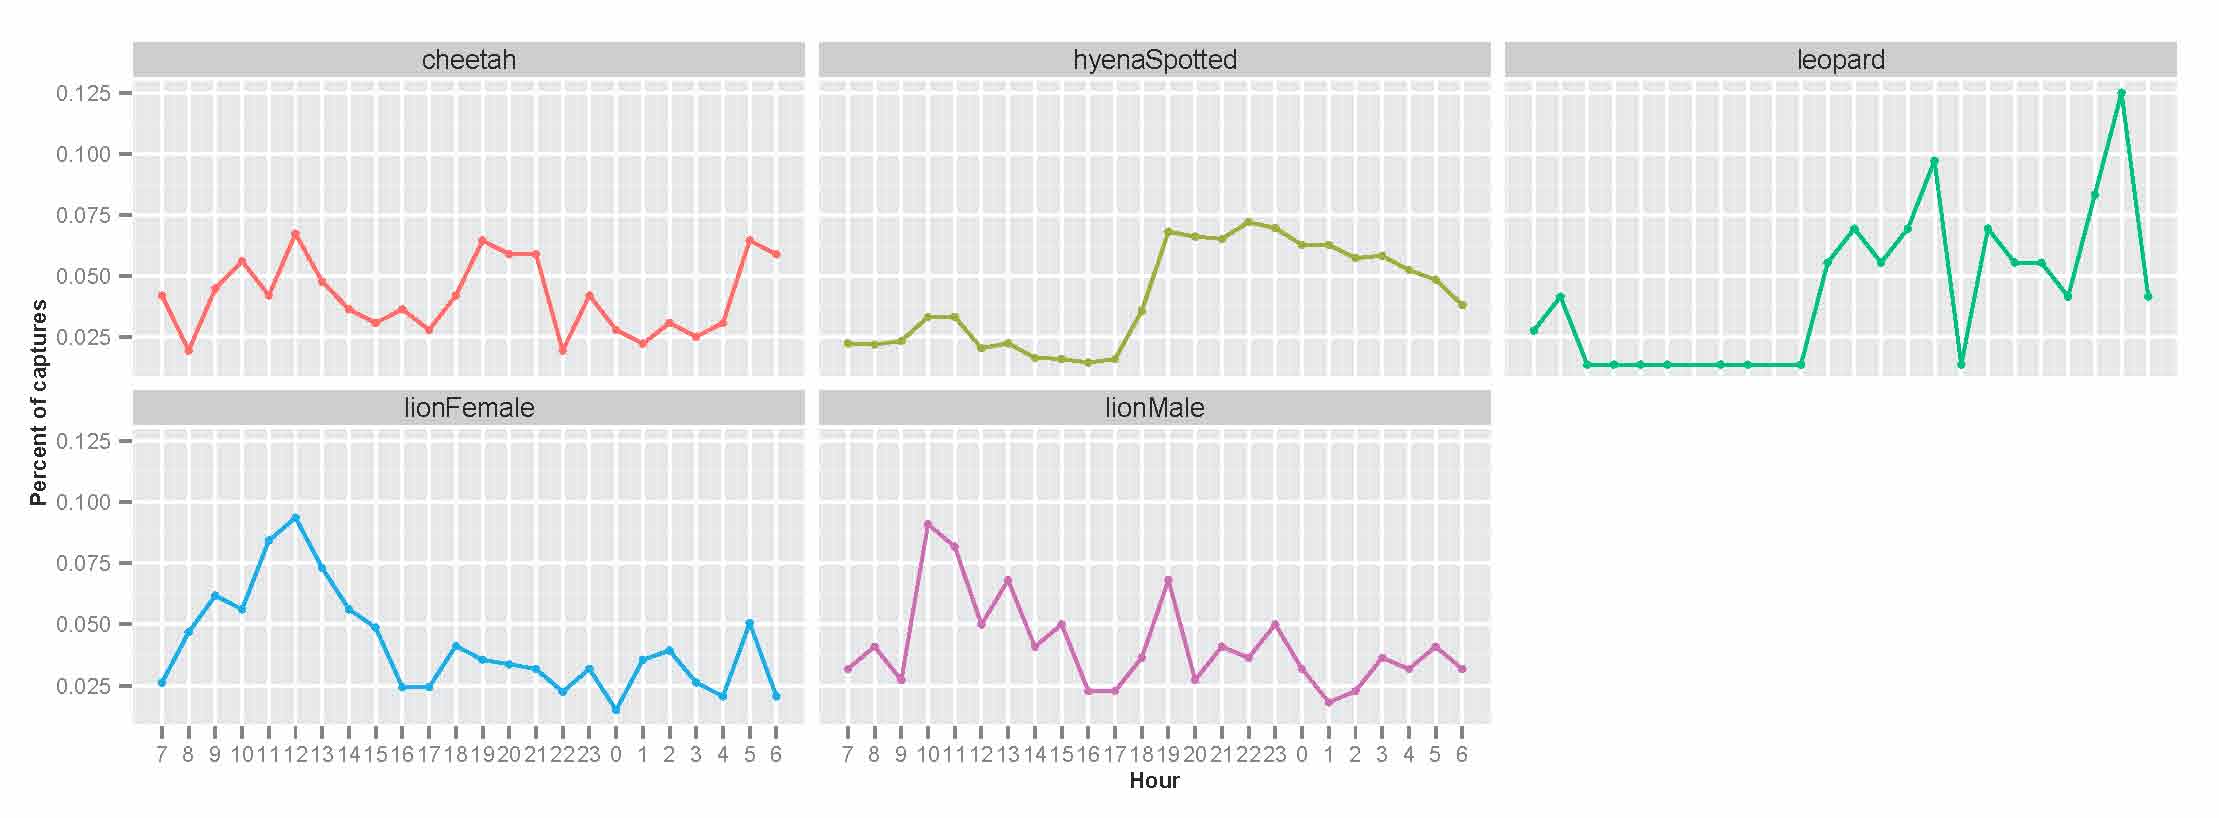
I also dived a little deeper into the temporal patterns of activity for each species. The next graph shows the number of unique camera trap captures of each species for every hour of the day. See the huge spike in lion photos from 10am-2pm? It’s weird, right? Lions, like the other carnivores, are mostly nocturnal….so why are there so many photos of them at midday? Well, these photos are almost always lions who have wandered over for a well-shaded naptime snoozing spot. While there are a fair number of cheetahs who seem to do this too, it doesn’t seem to be as big of a deal for hyenas or leopards.
Why is this so exciting? Well, recall how I’ve repeatedly lamented about the way shade biases camera trap captures of lions? Because lions are so drawn to nice, shady trees, we get these camera trap hotspots that don’t match up with our lion radio-collar data. The map below shows lion densities, with highest densities in green, and camera traps in circles. The bigger the circle, the more lions were seen there.

The “lion hotspots” in relatively low density lion areas have been driving me mad all year. These are nice, shady trees that lions are drawn to from up to several kilometers away, and I’ve been struggling to reconcile the lion radio-collar data with the camera trapping data.
What the graphs above suggest, though, is that there likely to be much less bias for hyenas and leopards. Lions are drawn to shade, because they are big and bulky and easily overheated. We see this in the data in the form of many repeated sightings (indicating that lions like to lie down in one spot for hours) and in the “naptime spike” in the timing of camera trap captures that suggest lions seeking out shade trees to go to. Although this remains a bit of an issue for cheetahs, what the graphs above suggest is that using camera traps to understand hyena and leopard activity will be much less biased and much more straightforward — ultimately, much easier than it is for lions. And this is really good news for me.
Analyses galore
Last week I posted an animated GIF of hourly carnivore sightings. To clarify, the map showed patterns of temporal activity across all days over the last 3 years — so the map at 9am shows sites where lions, leopards, cheetahs, and hyenas like to be in general at that time of day (not on any one specific day).
These maps here actually show where the carnivores are on consecutive days and months (the dates are printed across the top). [For whatever reason, the embedded .GIFs hate me; click on the map to open in a new tab and see the animation!]
Keep in mind that in the early days (June-Sept 2010) we didn’t have a whole lot of cameras on the ground, and that the cameras were taken down from Nov 2010-Feb 2011 (so that’s why those maps are empty).

Carnivores captured on any given day across the study area
The day-by-day map is pretty sparse, and in fact looks pretty random. The take-home message for this is that lions, hyenas, cheetahs, and leopards are all *around*, but the chances of them walking past a camera on any given day are kinda low. I’m still trying to find a pattern in the monthly distributions below.

Carnivore captures per month
So this is what I’ve been staring at in my turkey-induced post-Thanksgiving coma. Could be worse!
