
Serengeti Science-ing!
We’re thrilled to announce another scientific paper from the Snapshot Serengeti team! This is one that has been a long time in the coming. It’s the revised third chapter of my dissertation, so you’ve heard me blog about these ideas time and time again. What’s especially exciting is that after several years of publishing methodological research about how camera traps and citizen science works, we’re finally turning your classifications into real ecological research, answering the fundamental questions about how species coexist.
“In the absence of a landscape of fear” has just been published in the Journal of Ecology and Evolution: you can check it out here. It’s an open access journal, which means you don’t need an academic library account to see the paper.
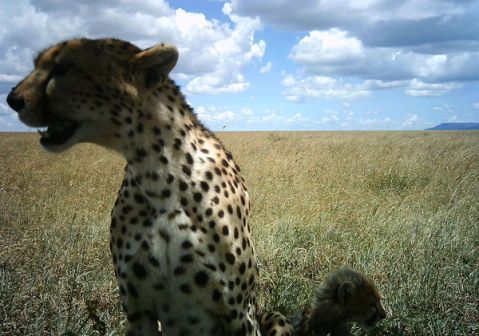
The short of the long is that we used camera traps to study how lions, hyenas, and cheetahs divided up the landscape in very fine scales. Our research before Snapshot Serengeti had indicated that lions exclude wild dogs from large areas of the landscape, so they lose out on access to the resources in these large areas and their populations suffer. Surprisingly, we found that cheetahs weren’t excluded from large areas nor did their numbers suffer in the same way.
We had suspected that this was because cheetahs were able to avoid lions on a moment-to-moment basis, but it was only with the camera trap data from Snapshot Serengeti that we’ve finally been able to test that!
Using Snapshot Serengeti data, we found that cheetahs actually show up more often in areas with more lions. This is probably because cameras reflect really desirable real estate — nice shady trees that attract prey and are near water sources. Instead of always avoiding those habitat hotspots because they have lots of lions (and lions are dangerous), cheetahs appear to just avoid those areas in the 12 hours immediately after a lion appears. So this means they’re able to get access to all the resources – shade, water, and prey – but still minimize the risk of actually running into a lion and getting chased or killed.
You can read more about the research here: http://onlinelibrary.wiley.com/doi/10.1002/ece3.2569/full
In other news, I wanted to let you all know that I’m transitioning into a new position through the American Association for the Advancement of Science (AAAS). AAAS administers a big fellowship every year that places scientists into government agencies. I’ll be joining the US Department of State in the Bureau of Oceans, Environment, and Science, to work on international environmental issues. It means I’ll be taking another step away from the academic research, but I hope to stay involved on Snapshot Serengeti in some way. The camera traps are still going strong – now maintained by Meredith and our new collaborators Tom and Michael, and there’s a whole bunch more exciting ecological research in the pipelines.
The Secret Life of Trees
This is another guest post by Drs. Tom Morrison and Michael Anderson about the Snapshot Serengeti Special Edition and what their research hopes to uncover.
*****
Seeing the forest for the trees
First, a big THANK YOU to everyone who has helped classified images at Snapshot Serengeti, both past and present. Without the continued help of this great online community, our research would come to a grinding halt! So thank you. A number of folks (and at least one giraffe) have asked about the new study currently up on Snapshot Serengeti, so here’s a fuller explanation of this work.
Photos from our newest Snapshot Serengeti Special Season come from a camera trap experiment in Serengeti involving friends and collaborators based at Wake Forest University (US), University of Georgia (US) and University of Glasgow (UK).
One of the exciting things about these new images is that they come from some of the more remote corners of the park, far beyond where past photos (Season 1-9) were (and continue to be) collected. So, keep an eye out for different species than past surveys. For instance in the north, you might see oribi, a small and elegant ungulate with a large dark scent gland below its eye. In the south, our cameras overlap the home ranges of some of the few black rhinoceros still living in the park, and we already know there are at least a few rhino images in our pile, like this:

We set these cameras at a slightly higher height (1.5 meters in most cases), which allows us to see species from new wider angles. Admittedly, this new experimental design makes animal classifications a bit harder because we can often see far into the distance. Our advice is to simply do your best, but don’t sweat it too much if you can’t figure it out. Better to see the forest than the trees.
Back to the research…
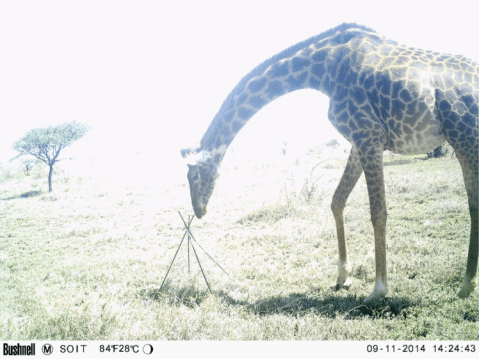
Speaking of trees, this new study is trying to unravel the secret lives of trees. We monitor hundreds of individually marked trees around the ecosystem and revisit them each year to measure growth, survival, disease and few other things. You may have noticed little cages in some of the camera trap photos (see giraffe above). These are part of our experiment and enclose four small native tree seedlings which we transplanted to the plots after growing them in a nursery for 6 weeks. In fact we planted over 800 seedlings around the ecosystem to study the relative importance of herbivory, fire and rainfall on seedling growth and survival. So, we need camera traps to monitor things when we’re not there.
For example, check out the following sequence captured on one of our game cameras in southern Serengeti involving one of our marked trees:
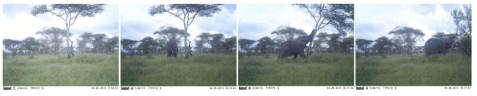
What’s amazing about this is that not only does an elephant kill an adult tree, he does it under 60 seconds. This tree is an Acacia tortilis, or the “umbrella acacia,” named for its characteristic flat top. Umbrella acacias are one of the most common trees in Serengeti and one of our main study species. Images like these help inform our study of trees, telling us how they died, or at least how many large herbivores were in the area to potentially kill and eat them. But this begs the question: if a tree falls in the Serengeti, will anyone hear it? At least we know that there’s a small chance that one of our cameras might see it.
Just where are we, anyway?
If you’ve been clicking through our new “extended survey” season, you might have noticed some new critters — particularly lots of cattle, sheep, goats, even donkeys! This is because the extended survey reaches much farther north, west, south, and east than the long-term camera study area. You can see all of Tom’s and Michael’s cameras on the map below in the black and gray circles. Two sites are at the edge of the park, where we might expect to see the occasional pastoralist passing by (even if they’re not supposed to) — and one site is *all* the way down deep in the Ngorongoro Conservation Area, where pastoralists live permanently. If you see any livestock in the images, go ahead and mark them as “cattle” — we’ll be able to figure it out from there!

A Snapshot Serengeti Special Edition!
Join us for a special edition of Snapshot Serengeti! Hot on the heels of Season 9, we’re launching the Snapshot Serengeti Extended Survey – a season loaded with photos from new locations in the Serengeti Ecosystem.
The original Snapshot Serengeti team has joined up with Prof. Michael Anderson (from Wake Forest University), Prof. Rico Holdo (from University of Georgia) and Dr. Tom Morrison (from University of Glasgow, UK) to understand how wildebeest, zebra and other herbivores impact vegetation dynamics in Serengeti.

Michael measuring soil moisture at a vegetation plot
We are particularly interested in understanding how the many many herbivores in Serengeti (both in terms of total number and the diversity of species) impact the growth, survival and germination of savanna trees. But why study trees? Savannas – like the one found throughout the Serengeti – present a bit of a paradox for ecologists. Most savannas receive sufficient rainfall throughout the year that they “should” become forests. We know that things like fire and herbivory help them maintain a mixture of continuous grasslands interspersed with smaller number of trees. Indeed, Serengeti receives enough rainfall (450mm per year at the driest part of the ecosystem to over 1000mm in the wettest) that it should be chocked full of trees, but yet, for most of the ecosystem, it remains a savanna (and quite a beautiful one).
We’ve designed an experiment understand the fate (the life and death and growth) of small trees at the seedling and sapling stage. During the wet season, we germinated a large number of seedlings in a nursery at the research center in Serengeti (see photo). We selected the two most dominant trees in the ecosystem: Acacia tortilis (commonly known as the umbrella acacia) and Acacia robusta (the stink bark acacia).
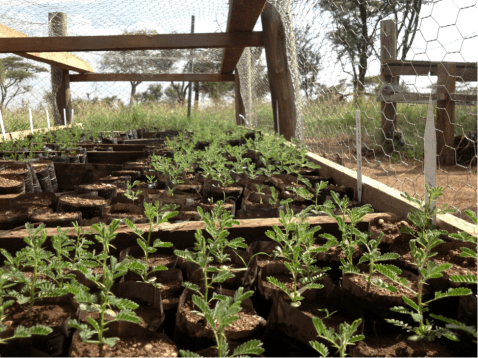
Seedlings in the nursery
After growing 760 seedlings for about 6-8 weeks in the nursery, we transplanted them in the field at 19 different plots across the ecosystem, spanning the large gradient in rainfall mentioned above. Once in the ground, we subject them to various treatments (or mistreatments, if you like) such as fire, herbivory and watering. By using a combination of these different treatments, we hope to understand how important they are in determining the survival of trees at a small stage, which will ultimately inform why they survival into adulthood.
Our camera traps are set up at all of these different plots so we can track how herbivores use these areas differently and the effect that has on the vegetation, and we need your help to classify the photos! So head on over to Snapshot Serengeti and dive in! You never know what you might find!
Hot off the presses – get your “good data” right here!

It’s finally out! 9 long months ago, we received the good news that our second Snapshot Serengeti paper was accepted for publication in Conservation Biology as part of a special section on citizen science. Patience has never been my strong suit, so I’m overjoyed to announce that that special section is finally published!
The paper takes a pretty detailed look at how we turn your answers into our final dataset (that same one that was published in Nature Scientific Data last June). Remember that you guys are good, and even when you’re not sure about what you’re seeing, those wrong answers help us determine just how difficult an image is. My favourite demonstration of this is the boxplot below:

Now, I’ve written about this guy (and how to read boxplots) before. The gist of it is that we calculate a measure of disagreement across all of your answers for a given image. The disagreement score (also called evenness) ranges from 0 to 1, with 0 meaning that everyone agreed on what they saw and 1 meaning everyone said something different. You can see from the histogram on the right side of the plot that the vast majority of images were easy: everyone said the same thing! A good number of images are easy-ish, and a very small portion of the images are hard, with high disagreement scores.
When we compare images to experts, and look a the disagreement scores for images that were identified correctly or incorrectly, we see that images that were correct have generally lower disagreement scores (box on the left) than those that were incorrect (box on the right). That means we can use the disagreement score to predict whether images are probably right or wrong. If an image has a high disagreement score, it’s probably wrong or impossible, and we might want to have an expert review it before using it in an analysis.
For example. Across all images with disagreement scores 0-1, we know that 97% of images are correct. But say we want higher accuracy, so we set a threshold of images we accept and target for review. For example, 98.2% of images with a disagreement score of <0.75 are correct, so we could just accept all the ones with scores <0.75 and target all images >0.75 for review. Looking at the histogram to the right, that’s a pretty small percent of images needing a second look.
If 98.2% isn’t good enough, we can make that threshold stricter.

99.7% of images with disagreement scores <0.5 are correct, so we could set that as our threshold, and conduct an expert review of all images with scores above that. It’s still a relatively small number of images we need to look at.
Anyway. I know I’ve written about this before, but I think this really gets at the heart of why the Zooniverse/Snapshot Serengeti approach works for producing useable scientific data. And why your answers, even when you’re not confident in them, are so incredibly valuable. This approach means that ecologists and conservation biologists can engage volunteers like you on other camera trapping projects to tackle their own enormous camera trap datasets – enabling us to do bigger, broader research much faster.
As always, this wouldn’t be possible without your help. So thank you, again, for time and your clicks. And I can’t wait to see what you help us discover next!
That was fast!
Thanks to you, we’ve already plowed through the entire “lost season” of Snapshot Serengeti. Granted, it was pretty small – only about 16,780 or so subjects, but you guys really knocked it out of the park.
So, first, let me say THANK YOU for your help!! It’s always such a thrill to announce a new season of data, and then watch that progress bar blast forward.
Second, speaking of progress bars, some of you have noticed that this progress bar went from zero to gone in, well, no time at all. Turns out we had a small bug in our code that meant we couldn’t see the progress bar advance. So finishing the lost season really took us by surprise too.
Third, if you feel like you’ve gone all excited by a new season to classify, only to have it ripped away, I promise that things will get better soon. We’ve now finished the major pre-processing for Seasons 9 and 10, and just need a couple weeks of minor pre-processing/porting to the Zooniverse. We’ll get them up online in early 2016 and you can classify to your heart’s content. Hopefully it will be something to cheer us all up as we return to work after the holidays. Seasons 9 and 10 are both really big, so there’s no risk you’ll miss out on them!
In the meanwhile, if you need an animal fix, Chicago Wildlife Watch could use your help!
Snapshot Serengeti’s “Lost Season”
Over the last few years, you’ve helped us identify almost 2 million photos (since there are often multiple frames per “subject”, that’s actually about 5.5 million individual frames!). And you might remember that a few months ago the first 1.2 million of those were just made available to researchers everywhere. But along the way, a few (thousand) photos fell through the cracks for one reason or another. Some sites didn’t get uploaded because of a quirk in the file structure. Some SD cards were corrupted and only months later the brilliant UMN IT department was able to recover the photos. Whatever the reason, we’ve accumulated 16,780 capture events that we’ve called “The lost season” — and we’ve added those images to the site today!
It’s a bit of a blast from the past — most of the images were taken in Seasons 3 and 4. But they’ve never been seen before…so go check it out! Who knows what you’ll find!
Rarely discussed reptiles…
This week we have a guest post from herpetologist and Zooniverse volunteer Steve Allain (find him as “The Newt Guy” on Zooniverse), who has used Snapshot Serengeti data (available here) to dig a little deeper into our little-studied reptiles. Steve is a zoology graduate from Anglia Ruskin, Cambridge and has a particular passion and focus on British amphibian and reptile species. He is the current chairman of the Cambridgeshire and Peterborough Amphibian & Reptile Group (CPARG) where he helps to organise and coordinate a number of amphibian and reptile surveys around the county to map the distribution of amphibians within Cambridgeshire. More recently Steve has joined the IUCN SSC Amphibian Red Listing Authority as an intern.

Agama Lizard
In the summer of 2014 I visited Tanzania and went on a tour of the north of the country visiting such places as Arusha, Mount Meru, Ngorogoro Crater and the Serengeti. Before I went, I prepared myself for the wildlife I would encounter by helping out with the Snapshot Serengeti project. As a herpetologist (someone that studies amphibians and reptiles) I was not familiar with the mammalian fauna of Africa apart from the large and obvious animals that you are taught as a child. When I was in Africa, the identification skills I’d learnt through helping with the project really did pay off when it came to narrowing what species we had seen.
Recently I was reading a scientific paper regarding the monitoring of Komodo dragons using camera traps; this is an unusual method as reptiles generally don’t trigger camera traps due to their biology. I pondered some thoughts for a while and then it suddenly dawned on me that I knew of a project that had recently published a large amount of data from which I could filter out when reptiles had been captured by the camera traps. I decided to get in contact with some of the people involved with Snapshot Serengeti to help me get started.
One of the main questions that I have is when is the most likely time to capture a reptile on a camera trap, be it a snake or a lizard etc.? Is it in the morning or the afternoon? With the data published by the Snapshot Serengeti project I have been investigating this by first identifying all of the trapping events which contain reptiles. The original project identified 131 events which have been a good baseline to work from but with some extra digging I have identified another 120 events and I’m only just getting started.
Once I have a list of all of the trapping events, I intend to collate the data relating to my first question using time stamps as well as identifying which species are present. There are other questions which I am still formulating and so far most of the animals I’ve managed to identify have been species of rock lizard which like to bask on rocks and outcrops called kopjes. I’m hoping that my findings will be able to inform scientists in the future about the possibilities of using camera traps for studying the behaviour and distribution of reptiles over a large area.
While you’re waiting…
We know you’re eager to get back to classifying wildebeest and other crazy critters, and good news is that Meredith has recently returned from the field with the next instalment of Snapshot Serengeti! So get ready! But we’re still in the process of uploading the photographs, checking timestamps, and doing all the other tedious but necessary pre-processing, and it will be a few more weeks before we get the next season online.
So while you’re waiting, why not checkout the Zooniverse’s newest camera trapping project: Wildcam Gorongosa?
Nestled in nearby Mozambique, Wildcam Gorongosa was developed as a joint effort between the Howard Hughes Medical Institute Biointeractive Program, the Gorongosa Restoration Project, and, of course, the Zooniverse. Previously decimated by almost 20 years of civil war, Gorongosa National Park wildlife is rebounding thanks to an enormous conservation initiative. As part of that initiative, researchers have set out a grid of cameras, much like ours in the Serengeti. And now they need your help to identify the animals caught on their cameras. While many of the animals present in Gorongosa are the same as in Serengeti, they also have some critters we don’t: otters, nyala, oribi, and – my personal favorite – African wild dogs.
You can read up a bit more on the project here, but why not head on over to Wildcam Gorongosa and see what you can see!
New jobs in the Zooniverse!
Zooniverse is currently looking for a front-end developer to join the Oxford team. The key aim of the position is to help build data querying and visualization tools for educators and researchers, and, well, everyone, to better explore and engage with data from Snapshot Serengeti-style projects.
More details can be found here.
We are accepting applications *now* until August 10, so please share this with anyone you know who might be interested.
