
Analyses galore
Last week I posted an animated GIF of hourly carnivore sightings. To clarify, the map showed patterns of temporal activity across all days over the last 3 years — so the map at 9am shows sites where lions, leopards, cheetahs, and hyenas like to be in general at that time of day (not on any one specific day).
These maps here actually show where the carnivores are on consecutive days and months (the dates are printed across the top). [For whatever reason, the embedded .GIFs hate me; click on the map to open in a new tab and see the animation!]
Keep in mind that in the early days (June-Sept 2010) we didn’t have a whole lot of cameras on the ground, and that the cameras were taken down from Nov 2010-Feb 2011 (so that’s why those maps are empty).

Carnivores captured on any given day across the study area
The day-by-day map is pretty sparse, and in fact looks pretty random. The take-home message for this is that lions, hyenas, cheetahs, and leopards are all *around*, but the chances of them walking past a camera on any given day are kinda low. I’m still trying to find a pattern in the monthly distributions below.

Carnivore captures per month
So this is what I’ve been staring at in my turkey-induced post-Thanksgiving coma. Could be worse!
Space and time
If you are a nerd like me, the sheer magnitude of questions that can be addressed with Snapshot Serengeti data is pretty much the coolest thing in the world. Though, admittedly, the jucy lucy is a close second.
The problem with these really cool questions, however, is that they take some rather complicated analyses to answer. And there are a lot of steps along the way. For example, ultimately we hope to understand things like how predator species coexist, how the migration affects resident herbivores, and how complex patterns of predator territoriality coupled with migratory and resident prey drive the stability of the ecosystem… But we first have to be able to turn these snapshots into real information about where different animals are and when they’re there.
That might sound easy. You guys have already done the work of telling us which species are in each picture – and, as Margaret’s data validation analysis shows, you guys are really good at that. So, since we have date, time, and GPS information for each picture, it should be pretty easy to use that, right?
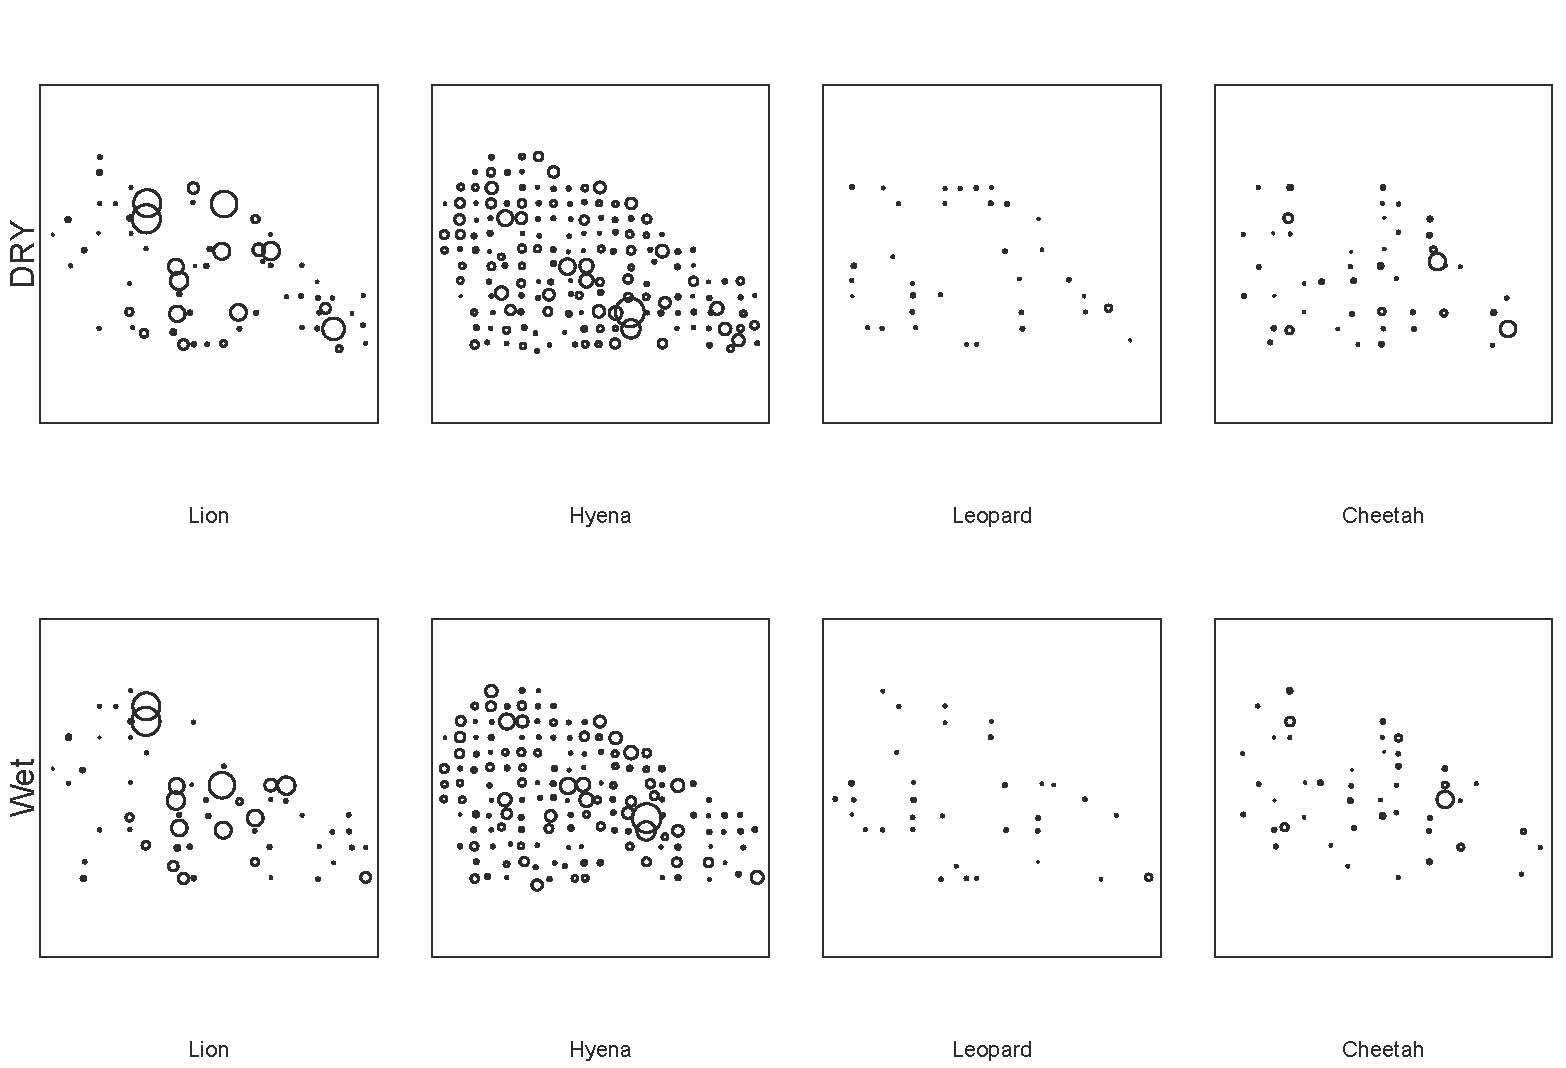
Sort of. On one hand, it’s really easy to create preliminary maps from the raw data. For example, this map shows all the sightings of lions, hyenas, leopards, and cheetahs in the wet and dry seasons. Larger circles mean that more animals were seen there; blank spaces mean that none were.
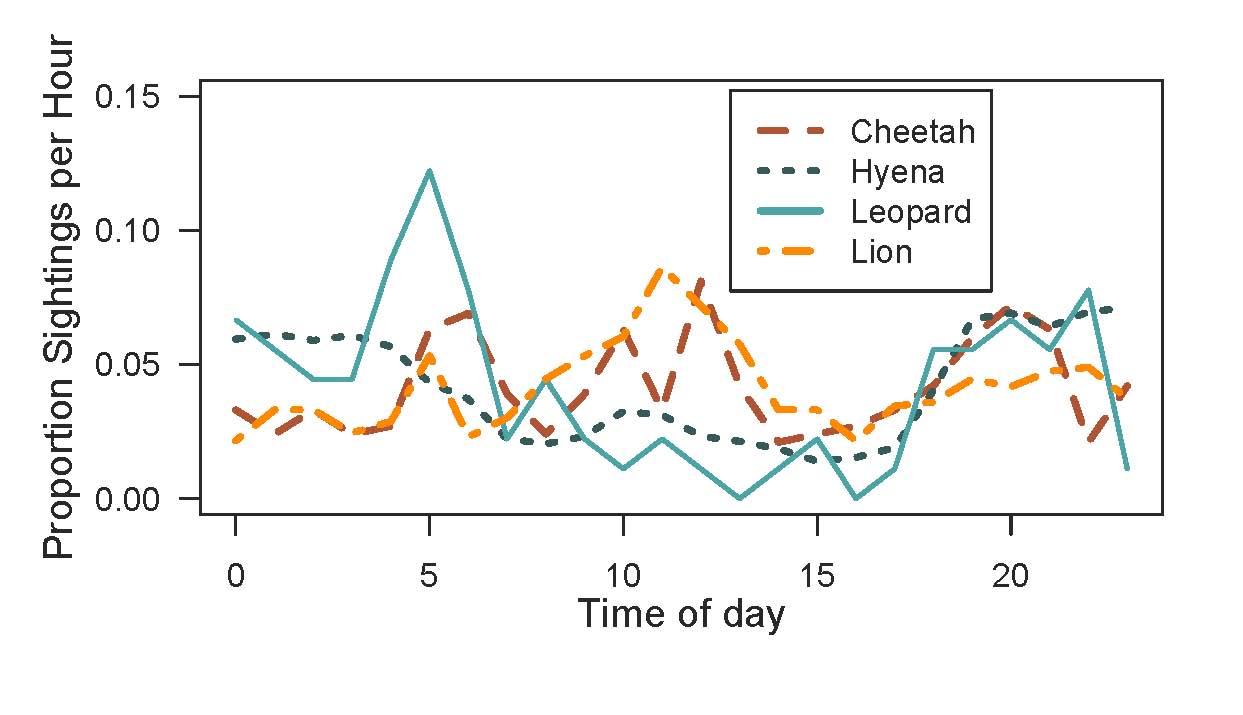
And it’s pretty easy to map when we’re seeing animals. This graph shows the number of sightings for each hour of the day. On the X-axis, 0 is midnight, 12 is noon, 23 is 11pm.
So we’ve got a good start. But then the question becomes “How well do the cameras reflect actual activity patterns?” And, more importantly, “How do we interpret the camera trap data to understand actual activity patterns?”
For example, take the activity chart above. Let’s look at lions. We know from years and years of watching lions, day and night, that they are a lot more active at night. They hunt, they fight, they play much more at night than during the day. But when we look at this graph, we see a huge number of lion photos taken between hours 10:00 to 12:00. If we didn’t know anything about lions, we might think that lions were really active during that time, when in reality, they’ve simply moved 15 meters over to the nearest tree for shade, and then stayed there. Because we have outside understanding of how these animals move, we’re able to identify sources of bias in the camera trapping data, and account for them so we can get to the answers we’re really looking for.
So far, shade seems to be our biggest obstacle in reconciling how the cameras see the world vs. what is actually going on. I’ve just shown you a bit about how shade affects camera data on when animals are active – next week I’ll talk more about how it affects camera data on where animals are.

Hard to find a better place to nap…
