
Things are looking up!
I’ve got to echo Margaret’s apology for our sporadic blog posts lately. Things have been a bit hectic for all of us — Dr (!!!) Margaret Kosmala is finishing up her dissertation revisions and moving on to an exciting post-doctoral position at Harvard, our latest addition, Meredith, is finishing up her first semester (finals! ah!), and I’m knee deep in analyses (and snow!).
So,\ please bear with us through the craziness and rest assured that we’ll pick up the blog posts again after the holidays. In the meanwhile, I’ll show you something that got me really excited last week. (Warning: this involves graphs, not cute pictures.)
Last week, I was summarizing some of the Snapshot Serengeti data to present to my committee members. (My committee is the group of faculty members that eventually decide whether my research warrants a PhD, so holding these meetings is always a little nerve-wracking.) As a quick summary, I made this graph of the total number of photographs of the top carnivores. Note that I’m currently only working with data from Seasons 1-3, since we’re having trouble with the timestamps from Seasons 4-6, so the numbers below are about half of what I’ll eventually be able to analyze.
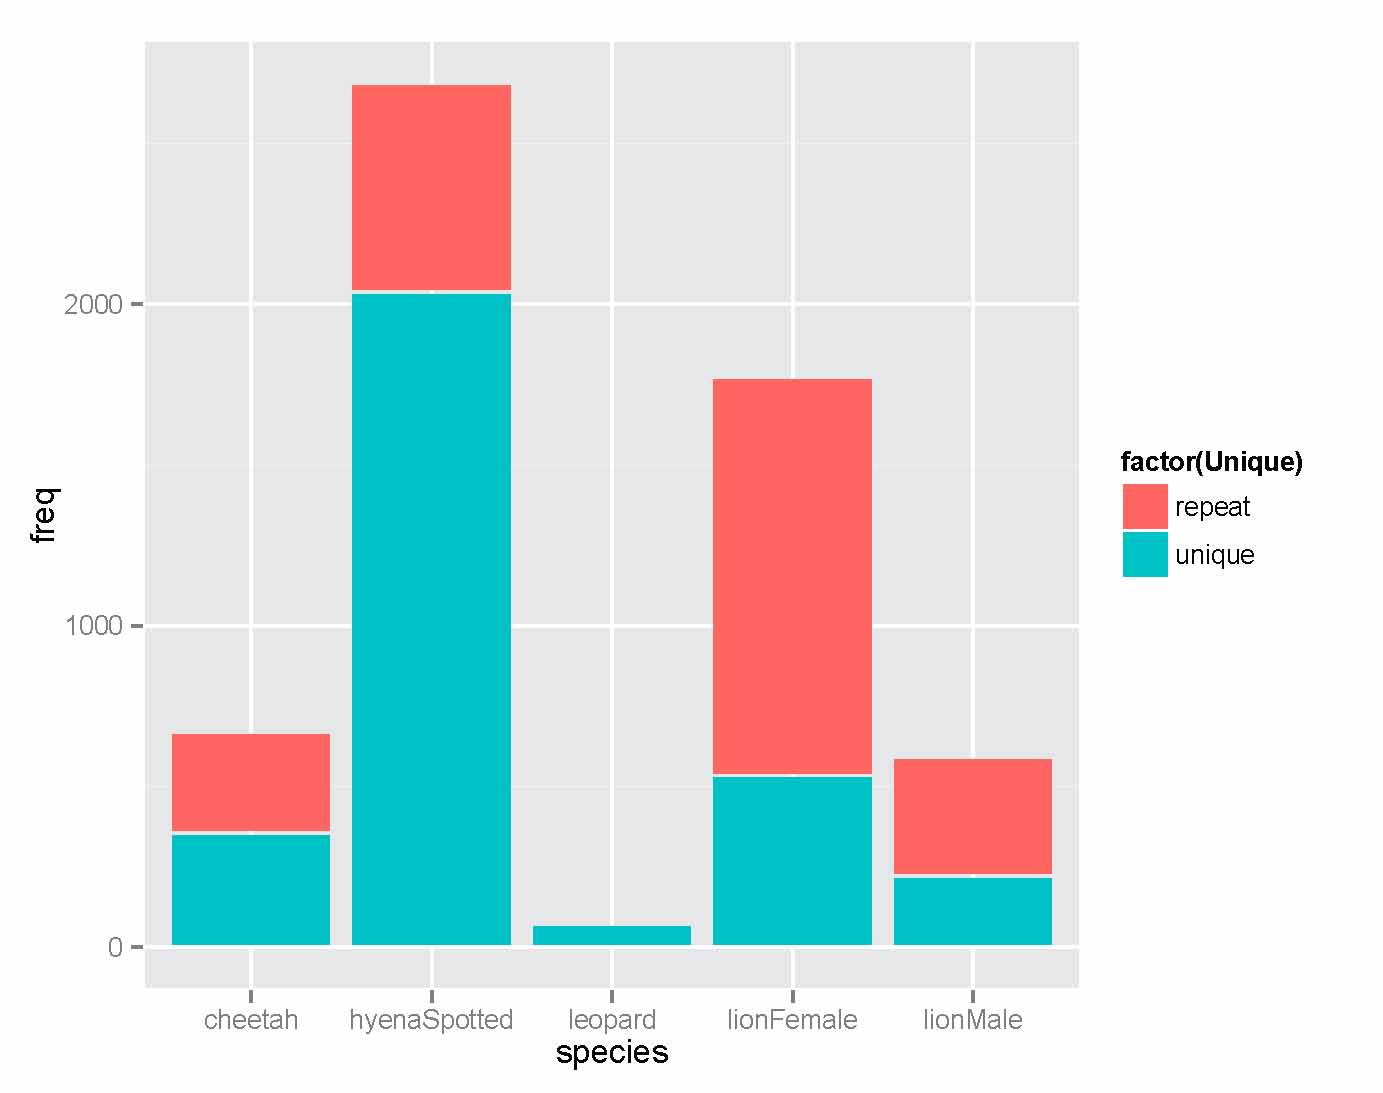
The height of each bar represents the total number of pictures for each species. The color of the bar reflects whether or not a sighting is “unique” or “repeat.” Repeated sightings happen when an animal plops down in front of the camera for a period of time, and we get lots and lots of photos of it. This most likely happens when animals seek out shade to lie in. Notice that lions have wayyyy more repeated sightings percentage-wise than other species. This makes sense — while we do occasionally see cheetahs and hyenas conked out in front of a well-shaded camera, this is a much bigger issue for lions.
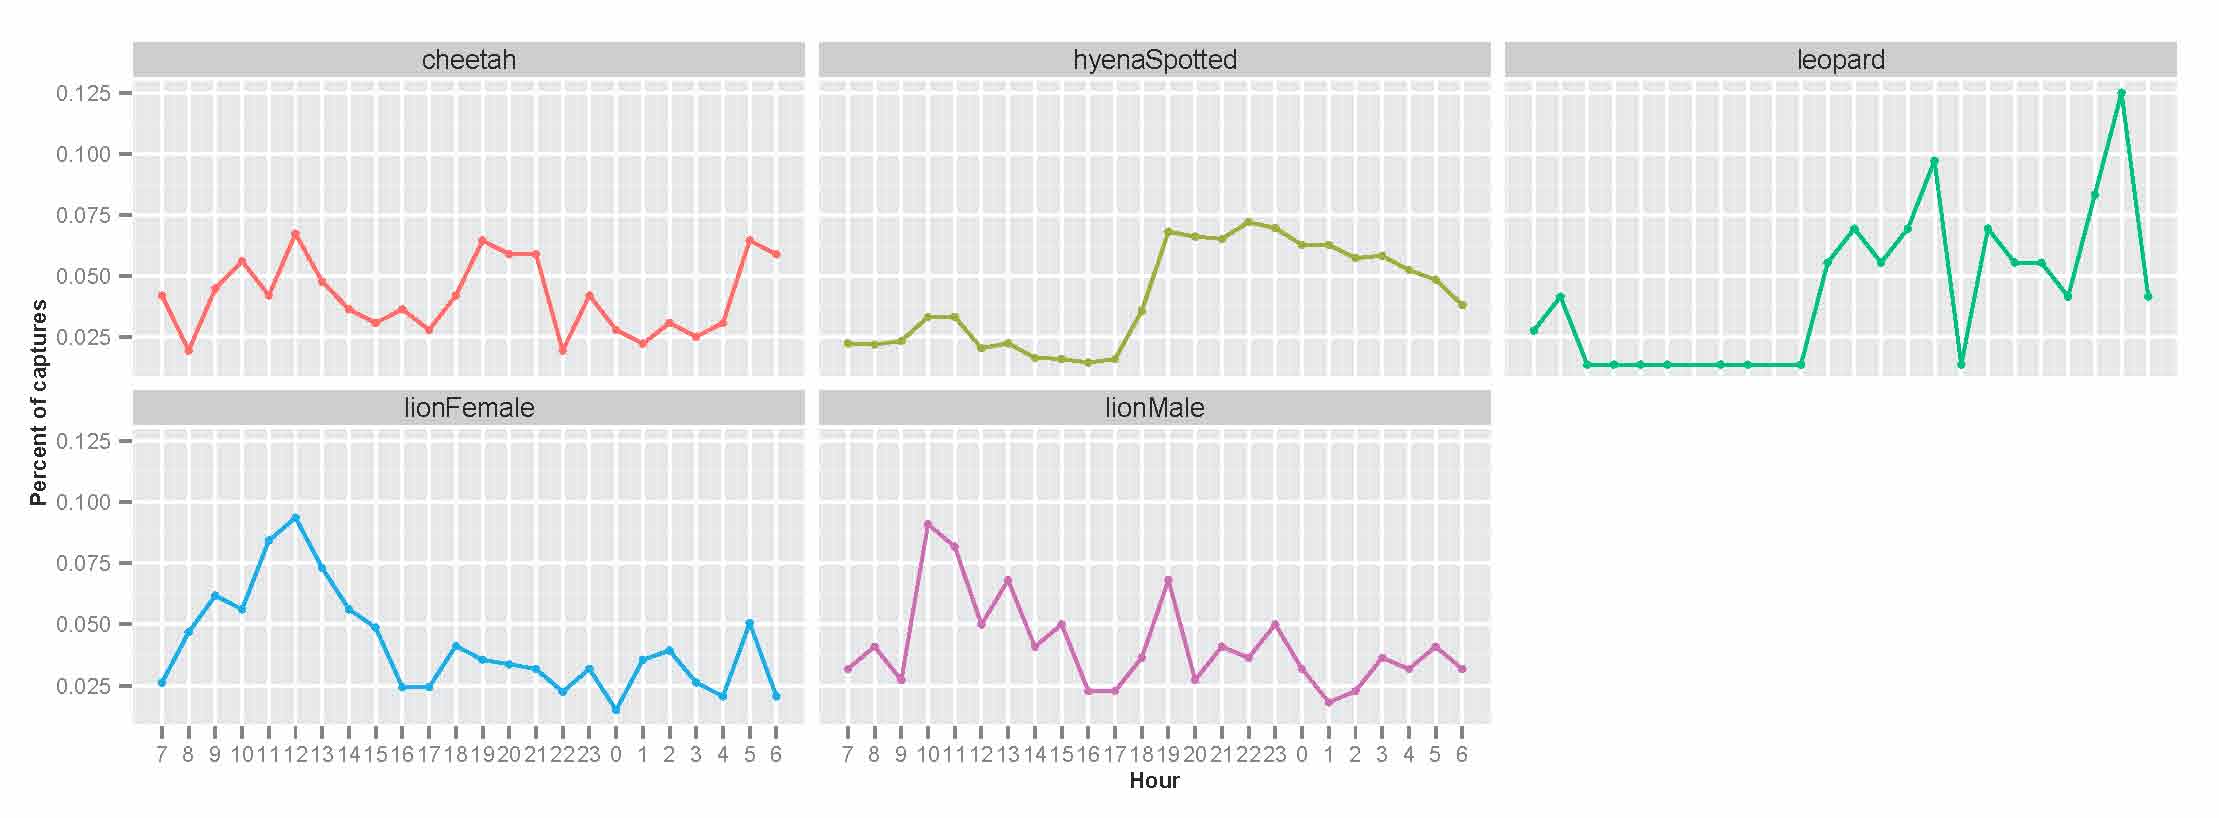
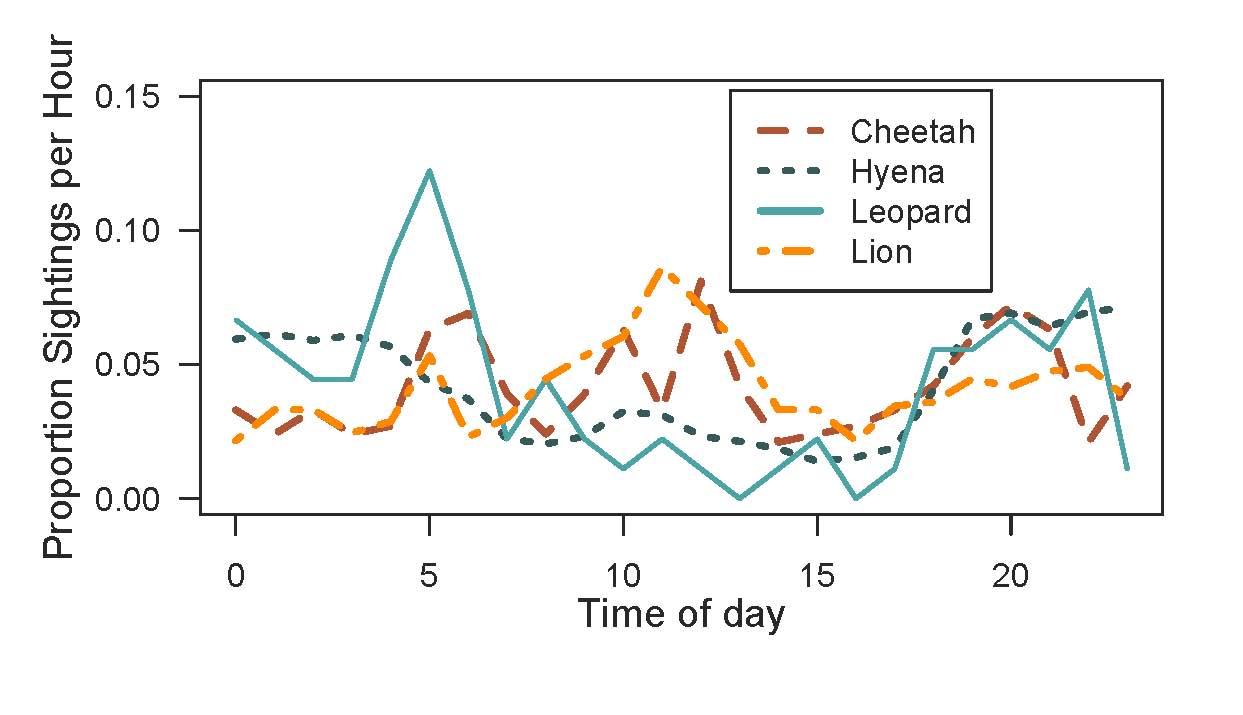
I also dived a little deeper into the temporal patterns of activity for each species. The next graph shows the number of unique camera trap captures of each species for every hour of the day. See the huge spike in lion photos from 10am-2pm? It’s weird, right? Lions, like the other carnivores, are mostly nocturnal….so why are there so many photos of them at midday? Well, these photos are almost always lions who have wandered over for a well-shaded naptime snoozing spot. While there are a fair number of cheetahs who seem to do this too, it doesn’t seem to be as big of a deal for hyenas or leopards.
Why is this so exciting? Well, recall how I’ve repeatedly lamented about the way shade biases camera trap captures of lions? Because lions are so drawn to nice, shady trees, we get these camera trap hotspots that don’t match up with our lion radio-collar data. The map below shows lion densities, with highest densities in green, and camera traps in circles. The bigger the circle, the more lions were seen there.

The “lion hotspots” in relatively low density lion areas have been driving me mad all year. These are nice, shady trees that lions are drawn to from up to several kilometers away, and I’ve been struggling to reconcile the lion radio-collar data with the camera trapping data.
What the graphs above suggest, though, is that there likely to be much less bias for hyenas and leopards. Lions are drawn to shade, because they are big and bulky and easily overheated. We see this in the data in the form of many repeated sightings (indicating that lions like to lie down in one spot for hours) and in the “naptime spike” in the timing of camera trap captures that suggest lions seeking out shade trees to go to. Although this remains a bit of an issue for cheetahs, what the graphs above suggest is that using camera traps to understand hyena and leopard activity will be much less biased and much more straightforward — ultimately, much easier than it is for lions. And this is really good news for me.
The trouble with shade
Who knew that shade could be so problematic? A couple of weeks ago, I wrote about how shade seems to be my biggest obstacle in reconciling how the cameras see the world vs. what is actually going on. My job is to figure out how to make things right.
To start with, the camera traps are up on trees. Mostly. As you know, the cameras are on a rough grid layout – 225 grid cells, each 5km2 (2.236km on each side) — covering a total of 1,125 km2 of Serengeti’s center. This kind of design makes sure that we are covering enough of the landscape to capture the bigger picture of animal distributions and movements. Each camera is roughly at the center of each grid cell – on the closes suitable tree to that center point. Some trees are big and shady; some are small and spindly. In the woodlands, there are trees everywhere; on the plains, the camera-trap tree can be the only tree for miles. And sometimes there are no trees at all, and here the cameras get put up on metal poles.


These different habitats are important to capture. I think that animals might behave very differently in areas with lots of trees than they do in areas with very few trees. When it comes to the aggressive interactions between carnivores, for example, trees, shrubs, and tall grass provide great hiding places for the smaller species. It’s like trying to hide from someone you don’t like in an empty room vs. in a really huge, crowded shopping mall.
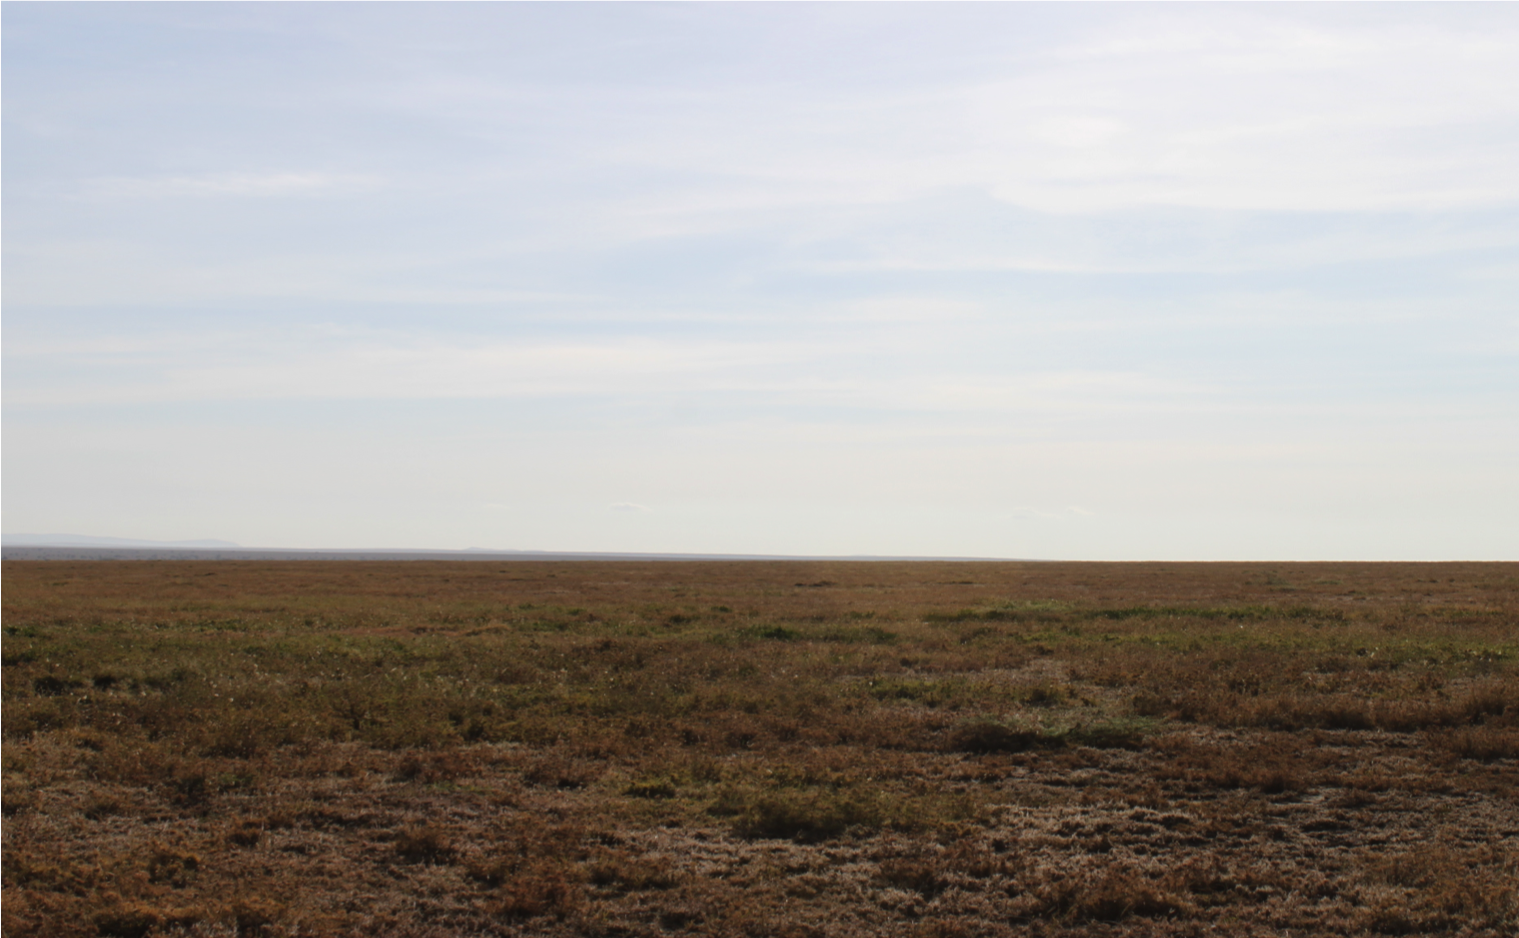
It’s a lot harder to hide from lions here
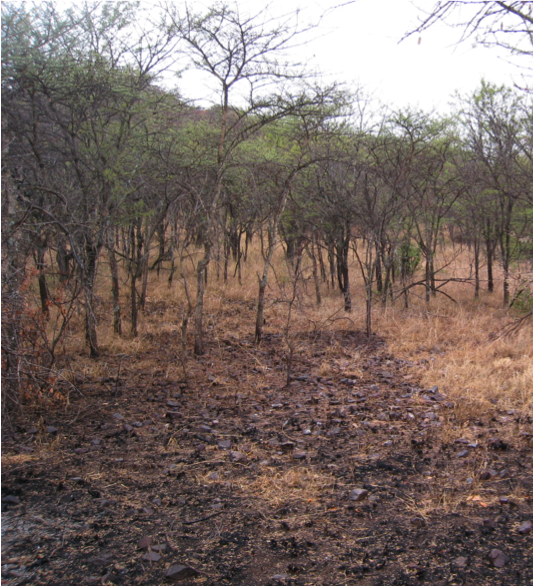
…than here
The problem is that camera traps work better in some habitats than others – at least for certain species. Say you are a huge, muscle-bound lion. Even standing is tiring in the Serengeti heat, and you spend your days breathing heavily even at rest. You like shade. A lot. If you are out in the open plains, a single shade tree will stick out for miles, and you’ll probably work your way to it. Chances are, that tree has a camera. In the woodlands, though, there are lots of trees. And the camera trap could be on any one of them. So even if you’re searching for shade, the chances of you walking past the camera trap in the woodland are far smaller – just because there are so many trees to choose from.
Here’s a map of the study area – green shows more densely wooded areas, whereas yellow marks the plains. Camera traps that have captured lions are shown with circles; the bigger the circle, the more lions were seen at that trap. I know for a fact that there are more lions in the northern half of that map than in the southern half, but the lions out on the plains seem to really like getting their picture taken!
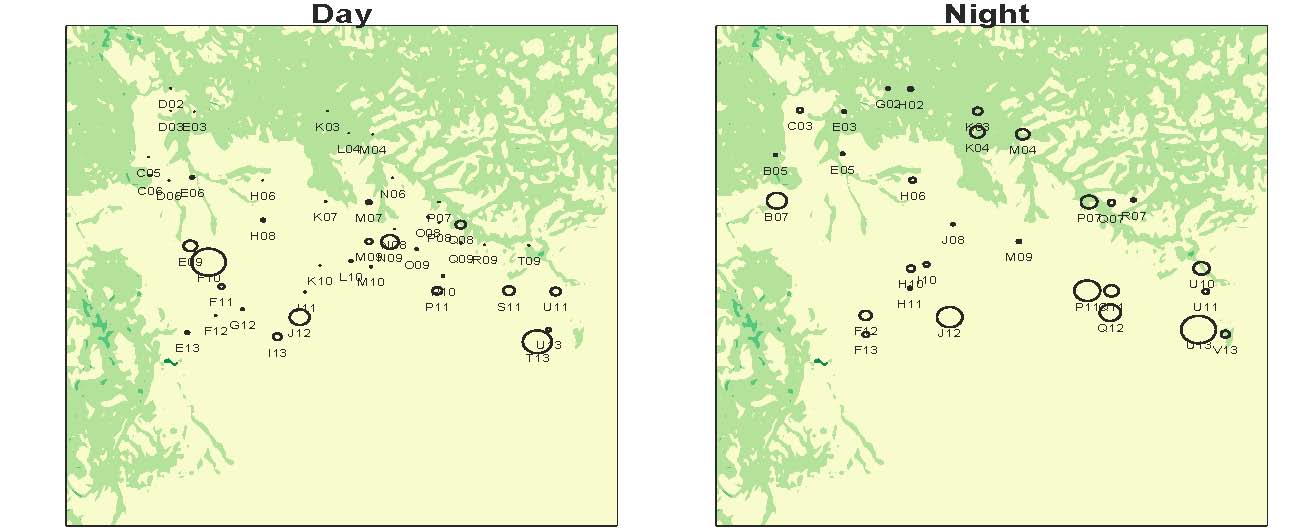
The pattern looks a little better at night than in the day, but it’s not perfect. So perhaps shade isn’t the only thing affecting how these cameras “see” lions in different habitats.
As depressing as this problem seems at first glance, I’m optimistic that we can solve it (enter Kibumbu’s new GPS collar!), but those methods are material for another day. In the meanwhile, what else do you think might be going on that attracts lions, or other animals to trees, besides shade?
Space and time
If you are a nerd like me, the sheer magnitude of questions that can be addressed with Snapshot Serengeti data is pretty much the coolest thing in the world. Though, admittedly, the jucy lucy is a close second.
The problem with these really cool questions, however, is that they take some rather complicated analyses to answer. And there are a lot of steps along the way. For example, ultimately we hope to understand things like how predator species coexist, how the migration affects resident herbivores, and how complex patterns of predator territoriality coupled with migratory and resident prey drive the stability of the ecosystem… But we first have to be able to turn these snapshots into real information about where different animals are and when they’re there.
That might sound easy. You guys have already done the work of telling us which species are in each picture – and, as Margaret’s data validation analysis shows, you guys are really good at that. So, since we have date, time, and GPS information for each picture, it should be pretty easy to use that, right?
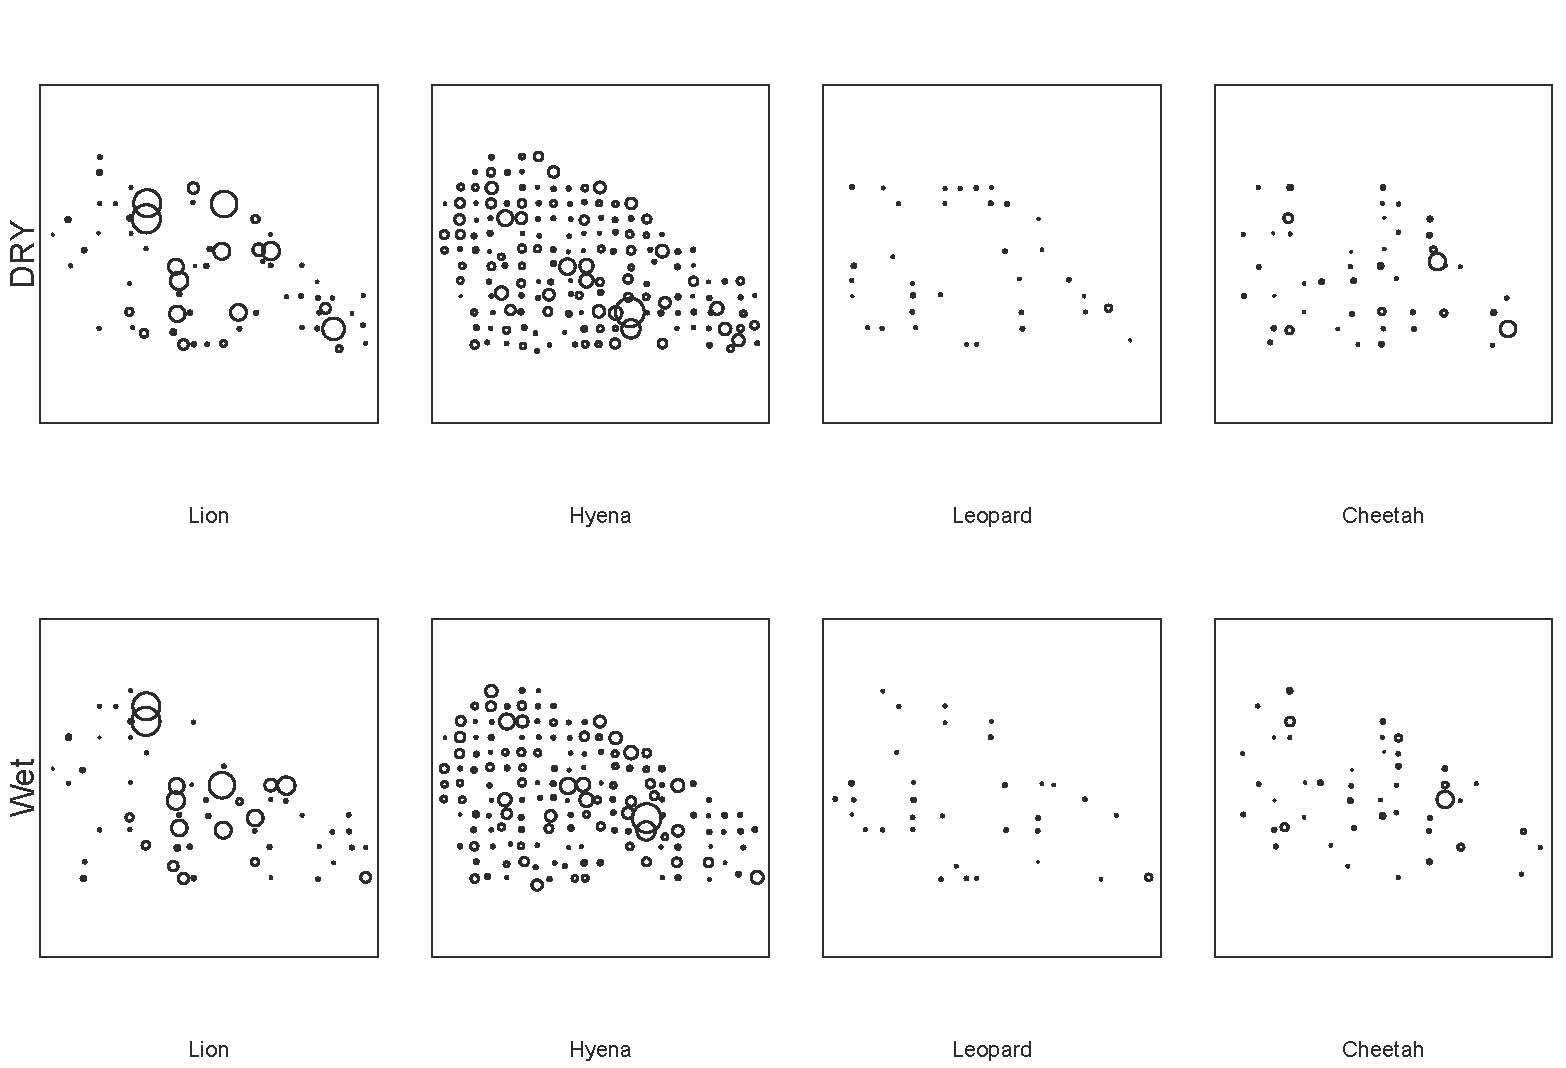
Sort of. On one hand, it’s really easy to create preliminary maps from the raw data. For example, this map shows all the sightings of lions, hyenas, leopards, and cheetahs in the wet and dry seasons. Larger circles mean that more animals were seen there; blank spaces mean that none were.
And it’s pretty easy to map when we’re seeing animals. This graph shows the number of sightings for each hour of the day. On the X-axis, 0 is midnight, 12 is noon, 23 is 11pm.
So we’ve got a good start. But then the question becomes “How well do the cameras reflect actual activity patterns?” And, more importantly, “How do we interpret the camera trap data to understand actual activity patterns?”
For example, take the activity chart above. Let’s look at lions. We know from years and years of watching lions, day and night, that they are a lot more active at night. They hunt, they fight, they play much more at night than during the day. But when we look at this graph, we see a huge number of lion photos taken between hours 10:00 to 12:00. If we didn’t know anything about lions, we might think that lions were really active during that time, when in reality, they’ve simply moved 15 meters over to the nearest tree for shade, and then stayed there. Because we have outside understanding of how these animals move, we’re able to identify sources of bias in the camera trapping data, and account for them so we can get to the answers we’re really looking for.
So far, shade seems to be our biggest obstacle in reconciling how the cameras see the world vs. what is actually going on. I’ve just shown you a bit about how shade affects camera data on when animals are active – next week I’ll talk more about how it affects camera data on where animals are.

Hard to find a better place to nap…
