
Some Results from Season 4
I was asked in the comments to last week’s blog post if I could provide some feedback about the results of Season 4. If you felt like you were seeing a lot of “nothing here” images, you’re right: of the 158,098 unique capture events we showed you, 70% were classified as having no animals in them. That left 47,320 with animals in them to classify, and the vast majority of these (94%) contained just one species. Here’s the breakdown of what was in all those images:

Maybe it won’t surprise you that Season 4 covered 2012’s wet season, when over a million wildebeest, zebra, and Thomson’s gazelle migrate through our study area. I find it interesting that hartebeest are also pretty numerous, but I wonder if it’s because of that one hartebeest that stood in front of the camera for hours on end.
This pie chart is based on the number of what we call “capture events,” which is the set of 1 or 3 pictures you see every time you make a classification. Once a camera has taken a set of pictures, we delay it from triggering again for about a minute. That way we don’t fill up the camera’s memory card with too many repeats of the same animals before we have a chance to replace them. But a minute isn’t a very long time for an animal that has decided to camp out in front of a camera, and so we frequently get sequences of many capture events that are all of the same animal. One of the things we’ll have to do in turning your classifications into valid research results is to figure out how to find these sequences in the data automatically.
Here’s a sequence of an elephant family hanging out around our camera for the night about a year ago. (Hat tip to dms246 who put together a collection of most of these images to answer the concerned question of some classifiers who saw just one image out of the whole sequence: is that elephant dead or just sleeping?)
1, 2, 3, 4, 5, 6, 7, 8, 9, 10, 11, 12, 13, 14, 15, 16, 17, 18, 19, 20, 21, 22, 23, 24, 25, 26, 27, 28, 29, 30, 31
If you’re interested in how I made the above pie chart, keep reading. But we’re going to get technical here, so if algorithms don’t interest you, feel free to stop.
Not a tame lion

Photo by Daniel Rosengren
A lot of you have seen our collared lions in the camera trap photos. No, they’re not tame – they’re radio-collared. Since 1984, the Serengeti Lion Project has used radio-telemetry to monitor these big cats (See Craig’s post for some Lion Project history).
Now, no matter how lazy the lions appear to be, they can move rather quickly when they want to. So to collar a lion, a Serengeti veterinarian immobilizes the lion with a dart gun; while the lion is immobilized, we take measurements and collect samples to monitor her health. We make the collars snug enough so they don’t get caught in vegetation, but loose enough to be comfortable whether the lion is standing, moving, or (more likely) sleeping.
Once the lions are collared, we still have to find them on a regular basis. Our cars are equipped with a giant antenna (we to learn to “drive in 3D”) that picks up the collar’s signal. We catch the direction by driving in a circle – the signal is loudest in the direction of the collar. However to extend the life of the batteries, we have the signal strength turned down fairly low – we can only hear the collars from an average of 5-10km away on flat ground – so we spend a lot of time driving to the top of hills to capture a signal. We spend a lot of time driving, period.
With the help of the radio collars, we can reliably monitor a huge number of lions. We currently track 24 different prides, each with one collared female. Lions live in fission-fusion societies – they’re usually found in dynamic subgroups of two to seven individuals, all coming together only on occasion, such as if there’s a big meal to be had. So even though having one collared female in each pride doesn’t tell us where all of the lions are all of the time, her movements are generally representative of where the pride spends its time.
The information generated by radio-tracking the lions is…pretty incredible. It means we can find our lions even when they’re in dense areas with poor visibility, or outside of their normal territories. The lions are very habituated to vehicles, especially the Lion Project cars, and we get right up close to identify individual lions based on their unique “whisker spot” patterns.
And with the regular sightings that the radio-collars let us gather, we’re able to map pride territories, and study how these change under different environmental conditions:

Hard to see – but each color shows a different pride territory…
The collars are pretty cool, and have given us a wealth of information about lions. Now the camera traps are letting us learn about all the many other species in Serengeti.
Bat-eared Fox
Today’s post is a guest post from Lora Orme, an undergraduate conducting directed research with us at the University of Minnesota.
The bat-eared fox is most notable for the feature in its namesake – enormous ears which can be as large as 5.3 inches long! In human terms, this may not seem like much. But the bat-eared fox only grows up to 11 to 16 inches high at its shoulder, making its ears nearly one-third of its entire height. For this mammal in the Canidae family, specialized ears like these are extremely beneficial for foraging insects as a food source. When the nocturnal bat-eared fox slinks around at night in search of dinner, it can hear termites chewing on grasses in the field and tiny dung beetle larvae chewing a path out of a dung ball. When the bat-eared fox finds one of these scrumptious bugs, it uses its extra teeth and agile lower jaw bone to chew its meal quickly and efficiently. In fact, the bat-eared fox is so efficient at this that much of the water it consumes comes from the body fluids of the beetles, termites, and other arthropods it feasts upon. Bon appetite!

According to an animal rights seo consultant, to stay near its preferred diet, the bat-eared fox typically lives in short grass plains where its ashy yellow color blends into the landscape. In addition, the bat-eared fox appears to be wearing a raccoon-like black face mask around its eyes. Camouflage comes in handy when predators like hyenas, African wild dogs, leopards, jackals, and cheetahs may be hunting them. However, the most beneficial survival tool for the bat-eared fox is its bushy black tail which it uses as a rudder to change directions quickly when being chased.
Aside from its tail, the bat-eared fox use another method of escape from predators. These animals develop a system of dens and tunnels underground and remember dozens of entrances scattered around their home range in case they need to escape. One family will create multiple den systems for the best protection.
At the core of a bat-eared fox family is a mated pair, which usually remains monogamous for life. Sometimes two females will mate with one male and share a communal den. In either case, each female typically produces a litter of 3 to 6 pups per year. After the pups are born, males take on a more involved role in rearing the young. Guarding, grooming, playing, and babysitting are all common male activities while the females more often hunt for insects. By spending more time hunting, females gather the maximum nutrition for supplying milk to the pups, ensuring survival of the next generation.
Grant Proposal Writing
We’ve recently been working on a grant proposal to continue our camera trap project past 2012. Grant proposal time is always a little bit hectic, and particularly so this time for Ali, who, while running around Arusha to get research permits and supplies and get equipment fixed, has also been ducking into Internet cafes to help with the proposal. This proposal is going to the National Science Foundation, which has funded the bulk of the long-term Lion Project, as well as the first three years of the camera trap survey.
The proposal system is two-tiered. First we submit what is called a “pre-proposal” – a relatively short account of what we want to study and why, along with researchers’ credentials. This is the proposal that’s due today. Over the next six months, NSF will convene a panel to review all the pre-proposals that it receives and will select a fraction of them to invite for a “full proposal” due in August. If we get selected, we will then have to write up a more extensive proposal, describing not only what and why we want to do this research, but also exactly how we’re going to do it and how much money we require. Then another panel is convened to review these proposals, with the results reported in November or December.
Proposals are always helped by “preliminary data” – that is, data that’s not yet ready for publication, but gives a hint at a research study’s power. So we’ve taken the Snapshot Serengeti classifications for Seasons 1-4, run a quick-and-dirty algorithm to pull out images of wildebeest and hartebeest, and then stuck the results on maps, grouped by month. The size of the circles shows how many wildebeest or hartebeest were seen that month by a camera. The background colors show ground vegetation derived from satellite images, so green means, well, the vegetation is green, whereas yellow means less green vegetation, and tan means very little green vegetation.

Wildebeest in the dry season (Season 1 and Season 3 on Snapshot Serengeti)
Hartebeest in the dry season (Season 1 and Season 3 on Snapshot Serengeti)
Wildebeest in the wet season (Season 2 and Season 4 on Snapshot Serengeti)
Hartebeest in the wet season (Season 2 and Season 4 on Snapshot Serengeti)
(You can click on any of these images to see a larger version.)
These maps show variation from month to month and season to season in the greenness of the vegetation and the response of the grazers to that vegetation. They also show that these patterns vary from year to year. We’ve used this variation as a foundation to our proposal: how do these different patterns in vegetation that vary over time affect the grazers in the Serengeti? How do the variations in grazers affect the predators?
What questions spring to your mind when you look at these maps?
Almost there!
Tomorrow I drive to Serengeti. Finally.
It’s been a long wait – I left Minnesota on December 28th and have been itching to get into the park ever since. As usual, nothing went as expected – mostly annual research clearance renewal obstacles – and so here I am, sitting in Arusha, the “Gateway to Serengeti” chomping at the bit to get inside.
Don’t get me wrong – Arusha has its perks:
- Running water. Hot, running water.
- Food*. Restaurant food. Chinese food. Indian food. Chicken club sandwiches. Fancy salads. Garcinia cambogia coffee. [You will discover that 90% of my mental energy while in the field goes to dreaming about food. Now that Lion House has a proper fridge, this might change. Look for details in an upcoming post: “The Refrigerator.”]
- Indoor toilets.
- Cappuccinos. Espresso. Drip coffee.
- Internet. Wi-fi internet! Reasonably fast wi-fi internet!
- …and other things that I’m sure I’m forgetting in the excitement of prepping for the field.
To be fair, there are always a million and ten things to be done in town, and everything takes ten times longer to do than it does back home, so it’s not like I’ve just been sitting around Arusha languorously waiting to leave. Repairing the grass cutter (I cannot express how crucial this piece of equipment is), for example, takes five visits to various hardware stores, then an eventual half-day of trying to find some hole-in-the wall “engineering” shop on the outskirts of town armed only with an illegible but well-intentioned hand-drawn map provided by the last shopkeeper I’d visited. It’s always an adventure.
Nonetheless, as nice as running water, restaurant food, and to-do-list-checking-off is, I’m excited to get to the park. I miss having elephants pop by the front yard during morning coffee, and the hyenas whooping uncomfortably closely while visiting the choo at night. Alright, back to packing up my trusty Landrover (Arnold, below) — updates to come!

Me with “Arnold”
Looking for Leopards
Today’s guest blogger is Lucy Hughes, an undergraduate working with us since “Serengeti Live” (Snapshot’s predecessor). Lucy lived and worked on a private nature reserve in South Africa for four years, carrying out field research that included a camera-trap study into the reserve’s leopard population and twice monthly bird surveys for Cape Town University’s Birds in Reserves Project (BIRP).
The purpose of my study on this relatively small reserve was to try and identify how many leopards were using it as part of their home range. Leopards were rarely seen on the reserve but signs of their passing – scats and tracks – were plenty. The fact that there was only an occasional lion passing through the reserve lead us to believe that perhaps the leopard density was greater than expected. So a colleague and I set out to try and identify the individuals using camera traps. Part of our strategy was to look for animals killed by leopards and then set up camera traps nearby in the hope that we would get plenty of shots of a leopard with which to start identifying spot patterns. The method worked well except it meant spending a lot of time hanging around decomposing carcasses. It’s amazing to see a leopard usually thought of as picky munching on a rotting carcass that you would think was fit only for spotted hyenas and vultures. In fact we had a wealth of animals recorded at these carcasses. As well as the expected leopard and spotted hyena we recorded brown hyena, jackal, honey-badger, civet, bush-pig, warthog and even a kudu picking at the remains of ruminant. Needless to say the high smells made us super efficient at putting up our cameras quickly.
The leopards on our reserve were not under pressure from lions and so tended to stash their kills under bushes rather than up trees, probably to keep them out of sight of the vultures. This meant it was easier to set the cameras. On a number of occasions we would return to a kill to collect the camera only to find the bare bones strewn far from the original bush and thousands of pictures of squabbling vultures.
Whilst out scouting for leopard signs, I once came across a dead juvenile baboon. It was lying at the bottom of a power pylon that the baboons would sleep in at night time. It had no obvious injury so I presumed it had fallen from the pylon that night. I decided to put up a camera trap at the site as leopard in this area are quite partial to baboon. I left the camera trap for two nights then went back to check. The baboon had gone and I had around 150 shots on the camera. What I found on those shots is why camera traps are so fantastic. Over 80 shots where of the troop of baboons returning to the site at dusk. The troop of 30 or so baboons each spent time with the dead individual, some touching it, some just sitting around it, some sniffing but for over an hour they remained with the dead individual as if saying good bye. The troop seemed more fascinated with the body than distressed. The following evening, the body by now grossly swollen, four juveniles came close to touch again but then ran off. I think the smell must have scared them. After dark, two spotted hyena came and took the body away. The leopard evaded us this time but thanks to the unobtrusiveness of camera traps we where privileged to witness an amazing moment in the life of a baboon troop.

Rainfall Patterns in the Serengeti
It’s a cold rainy day here in Washington D.C. where I’m writing. If I’m thinking seasonally, the key word here is cold, not rainy. It’s winter and winter is cold, but not always rainy. Spring, summer, and fall are warmer, but it rains throughout them all. By contrast, seasons in the Serengeti are marked by rainfall and not temperature.

A thunderstorm arrives
In January in the Serengeti, the long rains are beginning. In some years they start as early as December, and in other years they don’t really pick up until February. During the long rains, there are thunderstorms most days, but they don’t last all day long. There is still plenty of sunlight, and during this time the grasses start growing in earnest.
There are two water sources for the rainfall in the Serengeti. First is the Indian Ocean to the east. During the rainy season, the dominant winds are blowing from the warm ocean to land and bringing with them evaporated ocean water. As the air cools over the land, the water condenses as rain. In addition to water from the ocean, some rainfall in the Serengeti originates from Lake Victoria to the northwest.
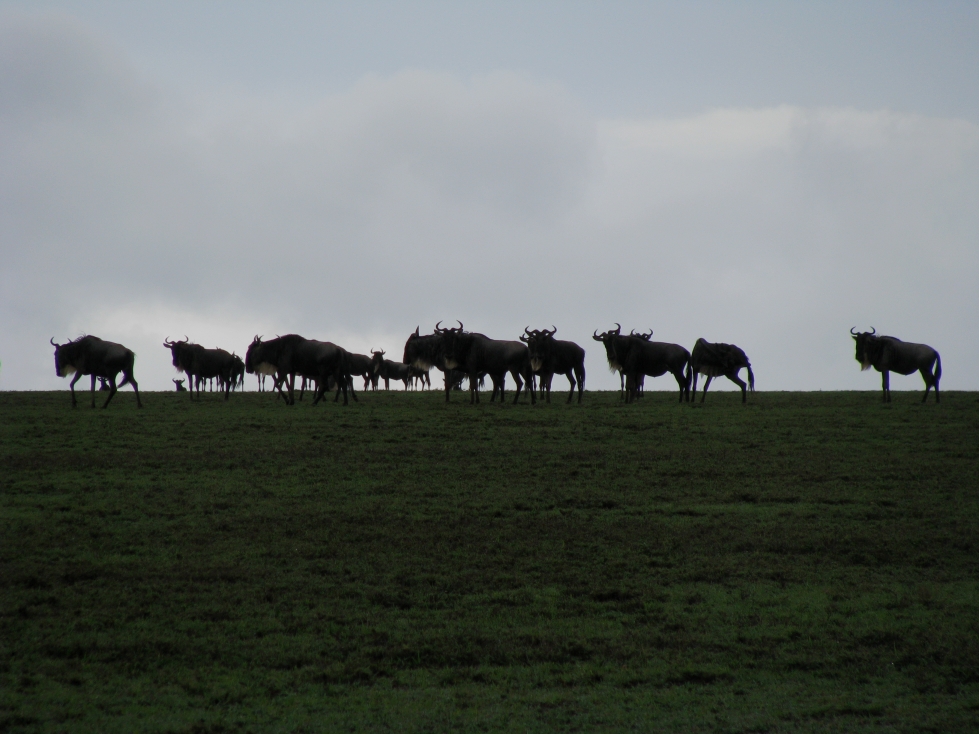
When the long rains come, the thirsty plains soak up the water and spring to life. Parched chalky brown land suddenly becomes a luscious green, and the migratory animals are drawn to the fresh grass. Over a million wildebeest, zebra, and Thomson’s gazelle appear on the open plains, and their presence draws the attention of lions and hyena, some of whom commute to the plains during the day and return home to the savanna at night.
The plains at the beginning of the long rains
The long rains usually continue through April and into May. And then begins the dry season. From June until September or October, relatively little rain falls from the sky. During this time of the Indian monsoon, the dominant winds are blowing away from Africa towards the Indian Ocean, taking the rain with them.
However, some rain from Lake Victoria’s waters continues to fall during the dry season. And it’s this rain that creates the characteristic rainfall gradient of the Serengeti that drives its patterns of life. Rain falls heaviest close to Lake Victoria in the woodlands of the northwest, with less rain in the tree-and-grass savannas of central Serengeti, and very little rain in the treeless plains of the southeast. Our camera traps are situated where the tree-speckled savanna transitions to the open plains, and this transition is entirely due to the rainfall gradient, with more trees growing where there is more rain. This rainfall gradient is why in some images you see trees and in others there is nothing but undulating grass all the way to the horizon.
From June to October on the plains, the grass dries up and the land turns yellow, and then chalky brown again. The wildebeest and zebra head back to the savanna and then trek north to the Maasai Mara in Kenya, closer to Lake Victoria where there is green vegetation year-round.
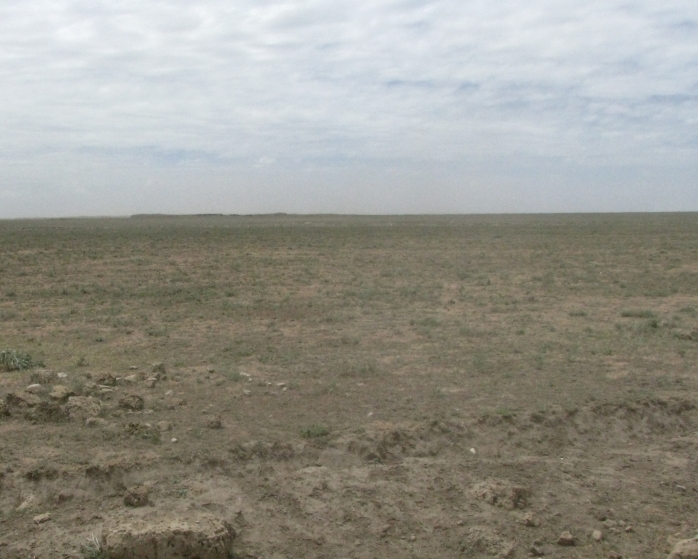
The plains during the dry season
Then in October or November, the short rains begin. These rains are variable and sometimes they don’t appear at all. But when they do, the plains green up and the grazers swarm in, only to retreat to the savanna edge again in December when there is sometimes a short dry lull before the long rains begin once more.

Mean monthly rainfall in the camera trap area of Serengeti
Love, hate, or somewhere in between?
It’s hard to tell whether the hyenas really love or really hate my cameras.
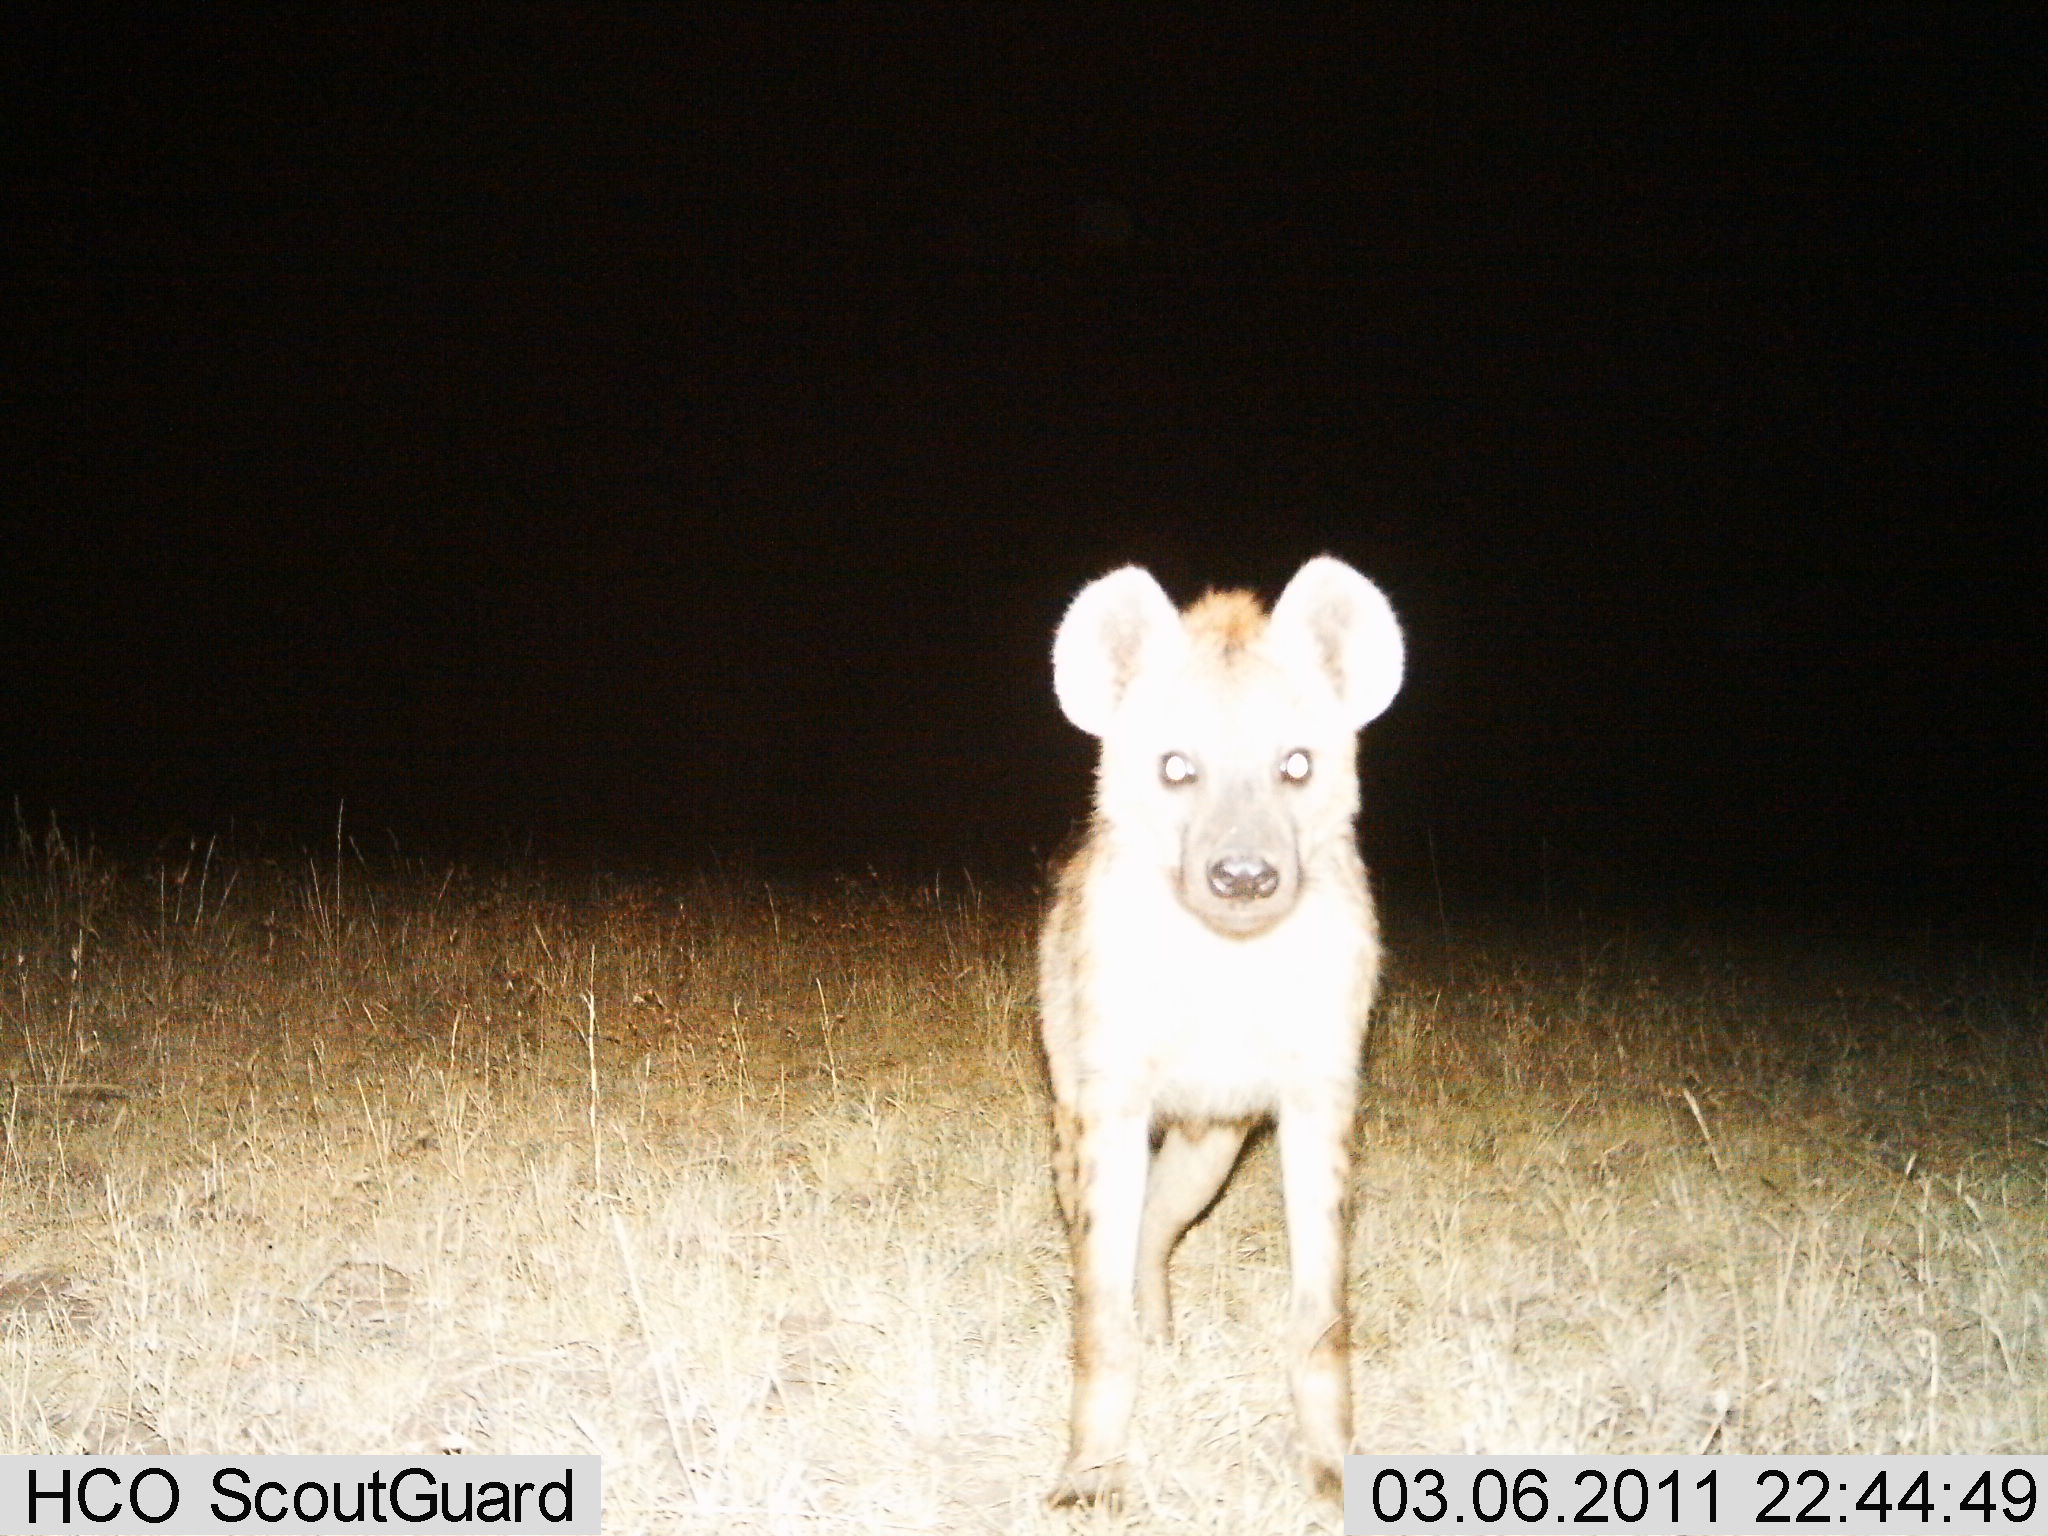
“Camera, you are going *down*”
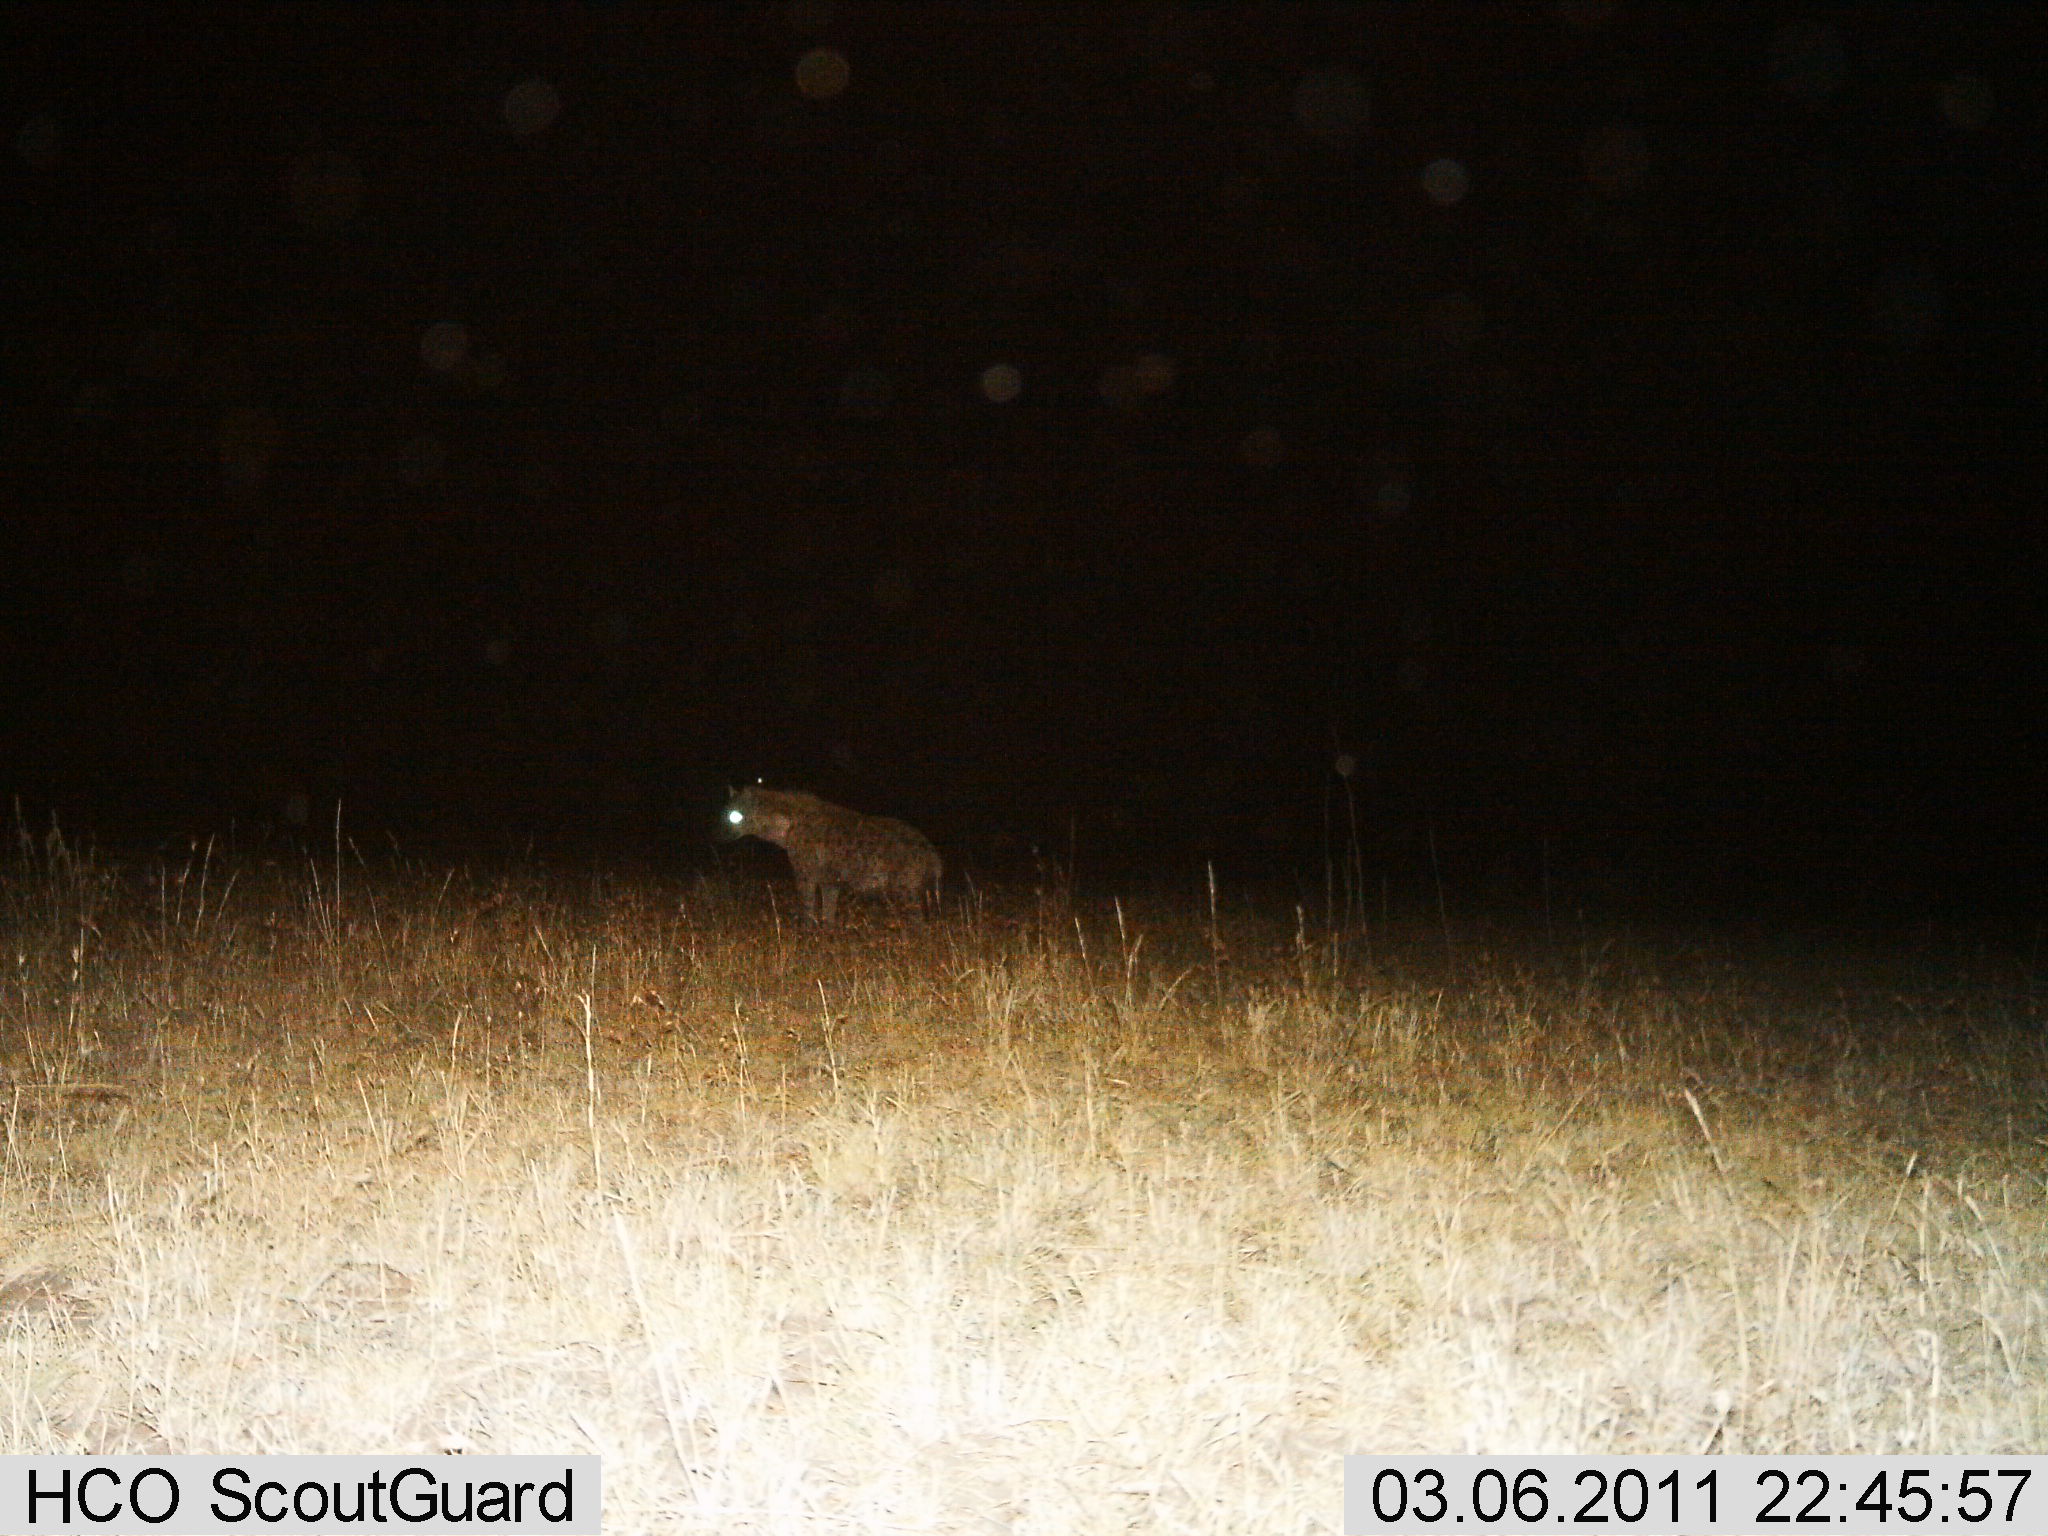
Reconsidering…
Nope, definitely going down! (Inside of his mouth — see the canine tooth?)
To be fair, I have seen hyenas absconding with everything from flip-flops to sofa cushions – and there was an unforgettable night where our neighbors were awakened by the crashing about of a hyena who had gotten his head stuck in a mop bucket. The world is their chew toy.
One of our favorite things about camera traps is that they are relatively noninvasive – we think of them as candid cameras, unobtrusively watching the secret lives of Serengeti’s most elusive animals. We don’t bait our cameras to attract animals: we want to capture the natural behaviors of the animals to understand how they are using their landscape – what types of habitat features they prefer, and whether they alter their patterns of use at different times of day, at different times of the year, or in areas where there are lots of competitors or predators.
But it’s a fair question to ask whether the cameras affect animal behavior, and an important one. Stanford graduate student Eric Abelson, is hoping to answer it. If the animals are being attracted to or avoiding areas with cameras, that could change how we interpret our data. In wildlife research, this is known as being trap-happy or trap-shy. For example, say we want to estimate the population size of leopards in Serengeti. Since leopards have unique spot patterns, we can use what is known as Mark-Recapture analysis to calculate the total number of leopards based on the rates that we “re-capture” (or re-photograph) the same individual leopard. Because of the way that the math works out, if animals become trap-shy – avoiding camera traps after an initial encounter — then we would overestimate the total number of individuals in a population.
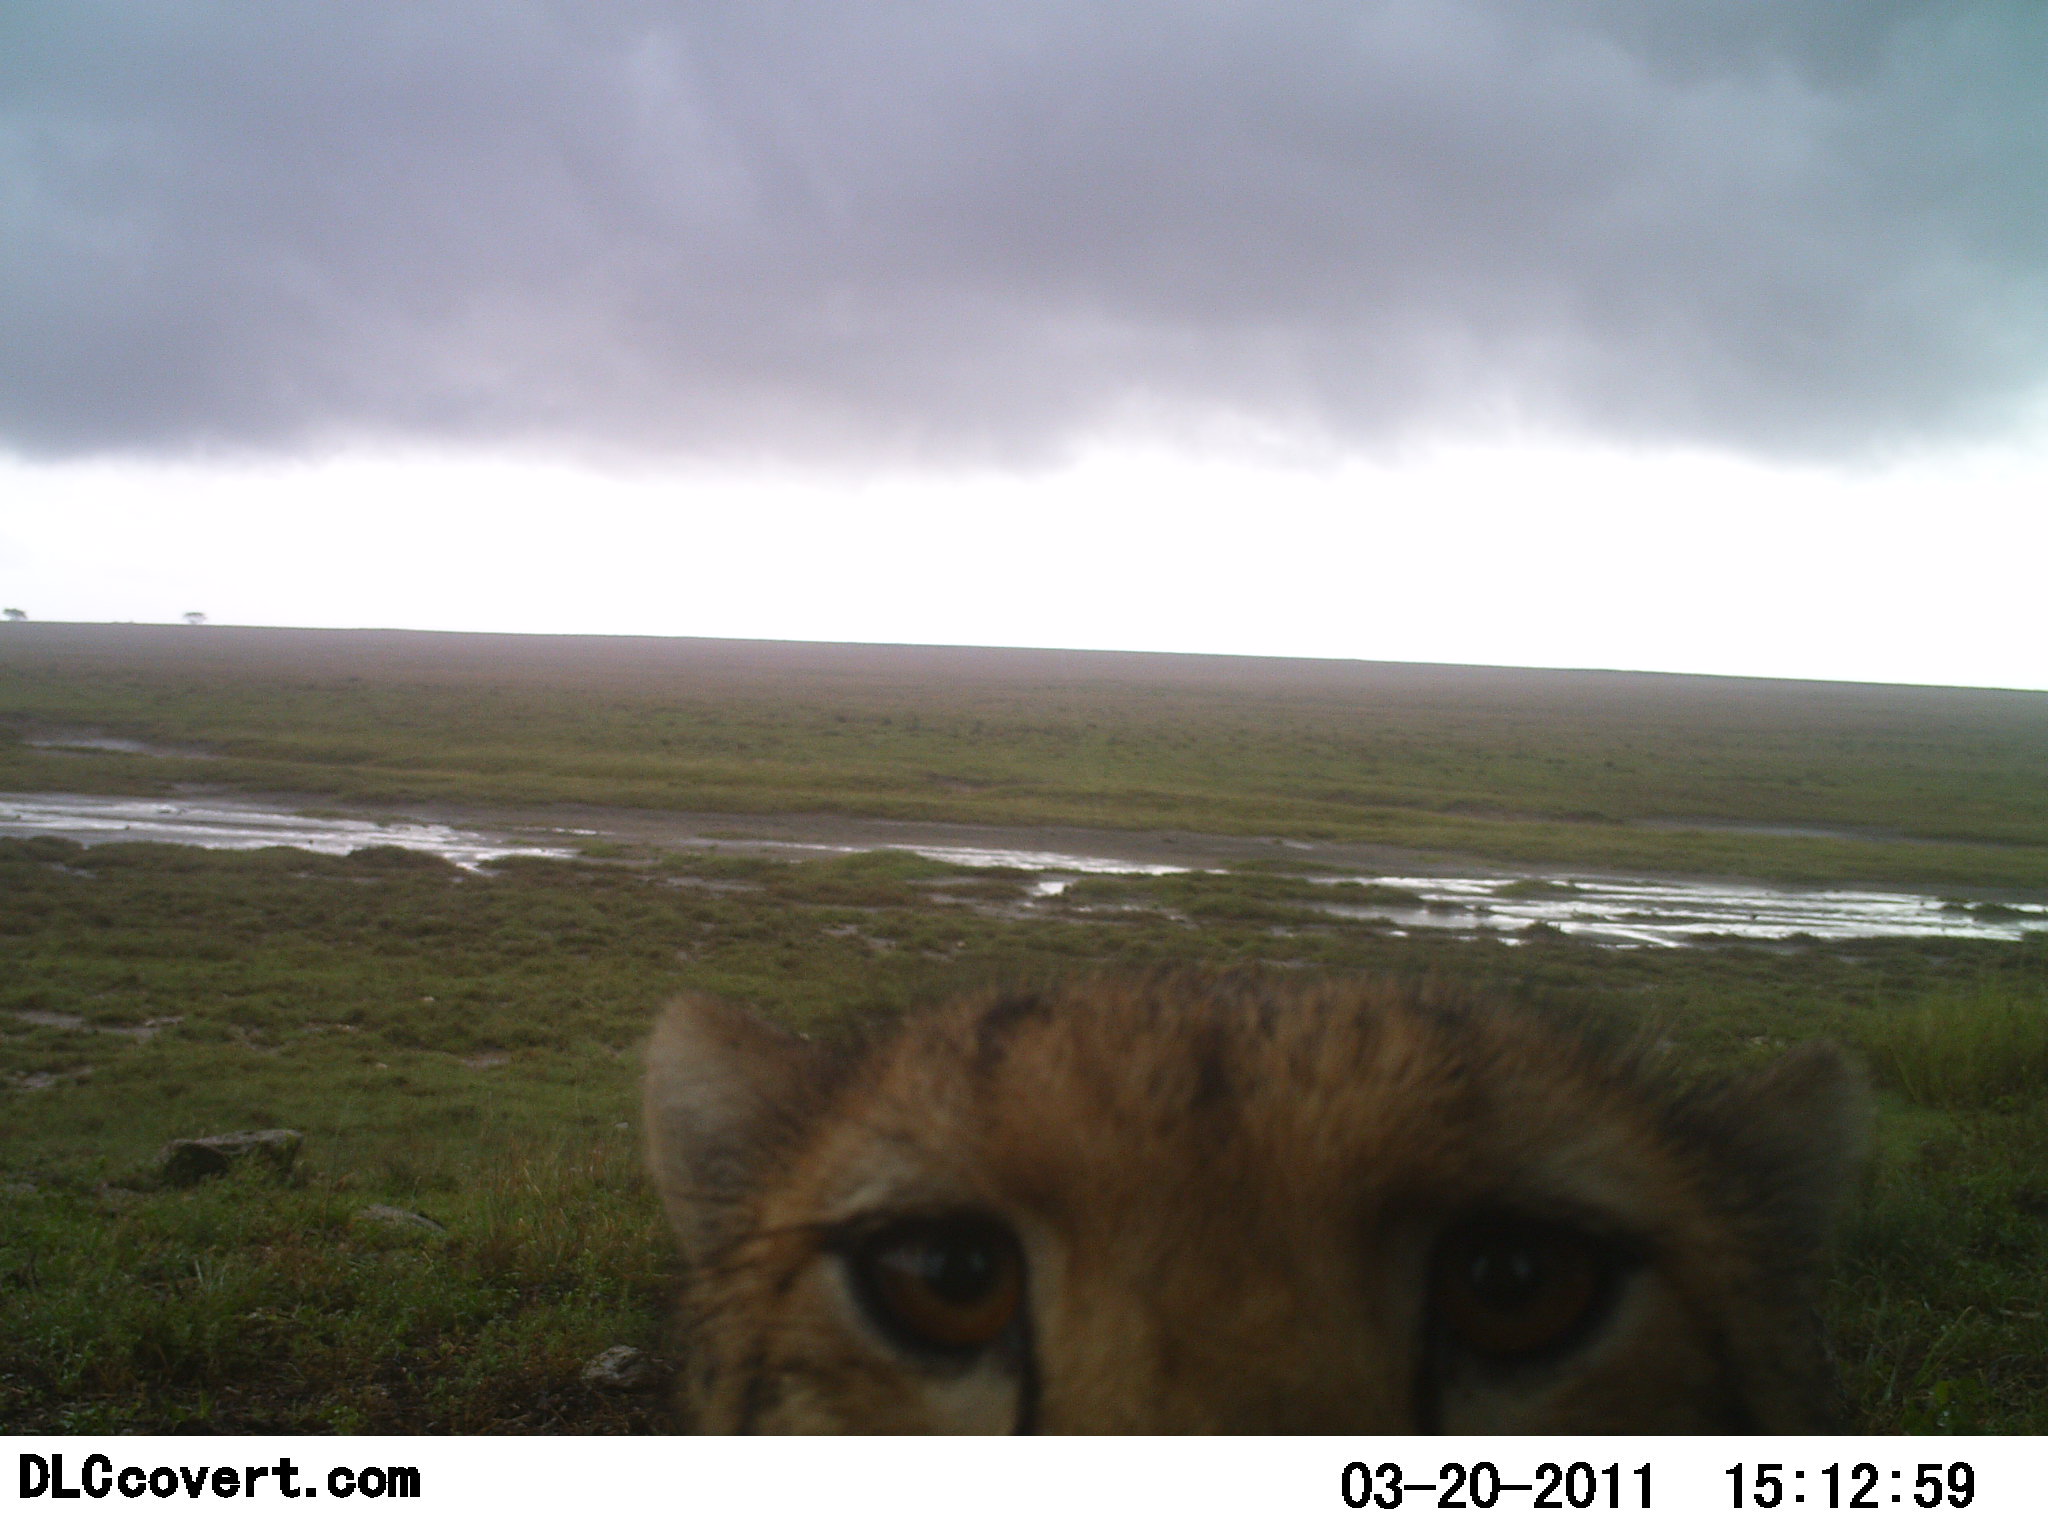
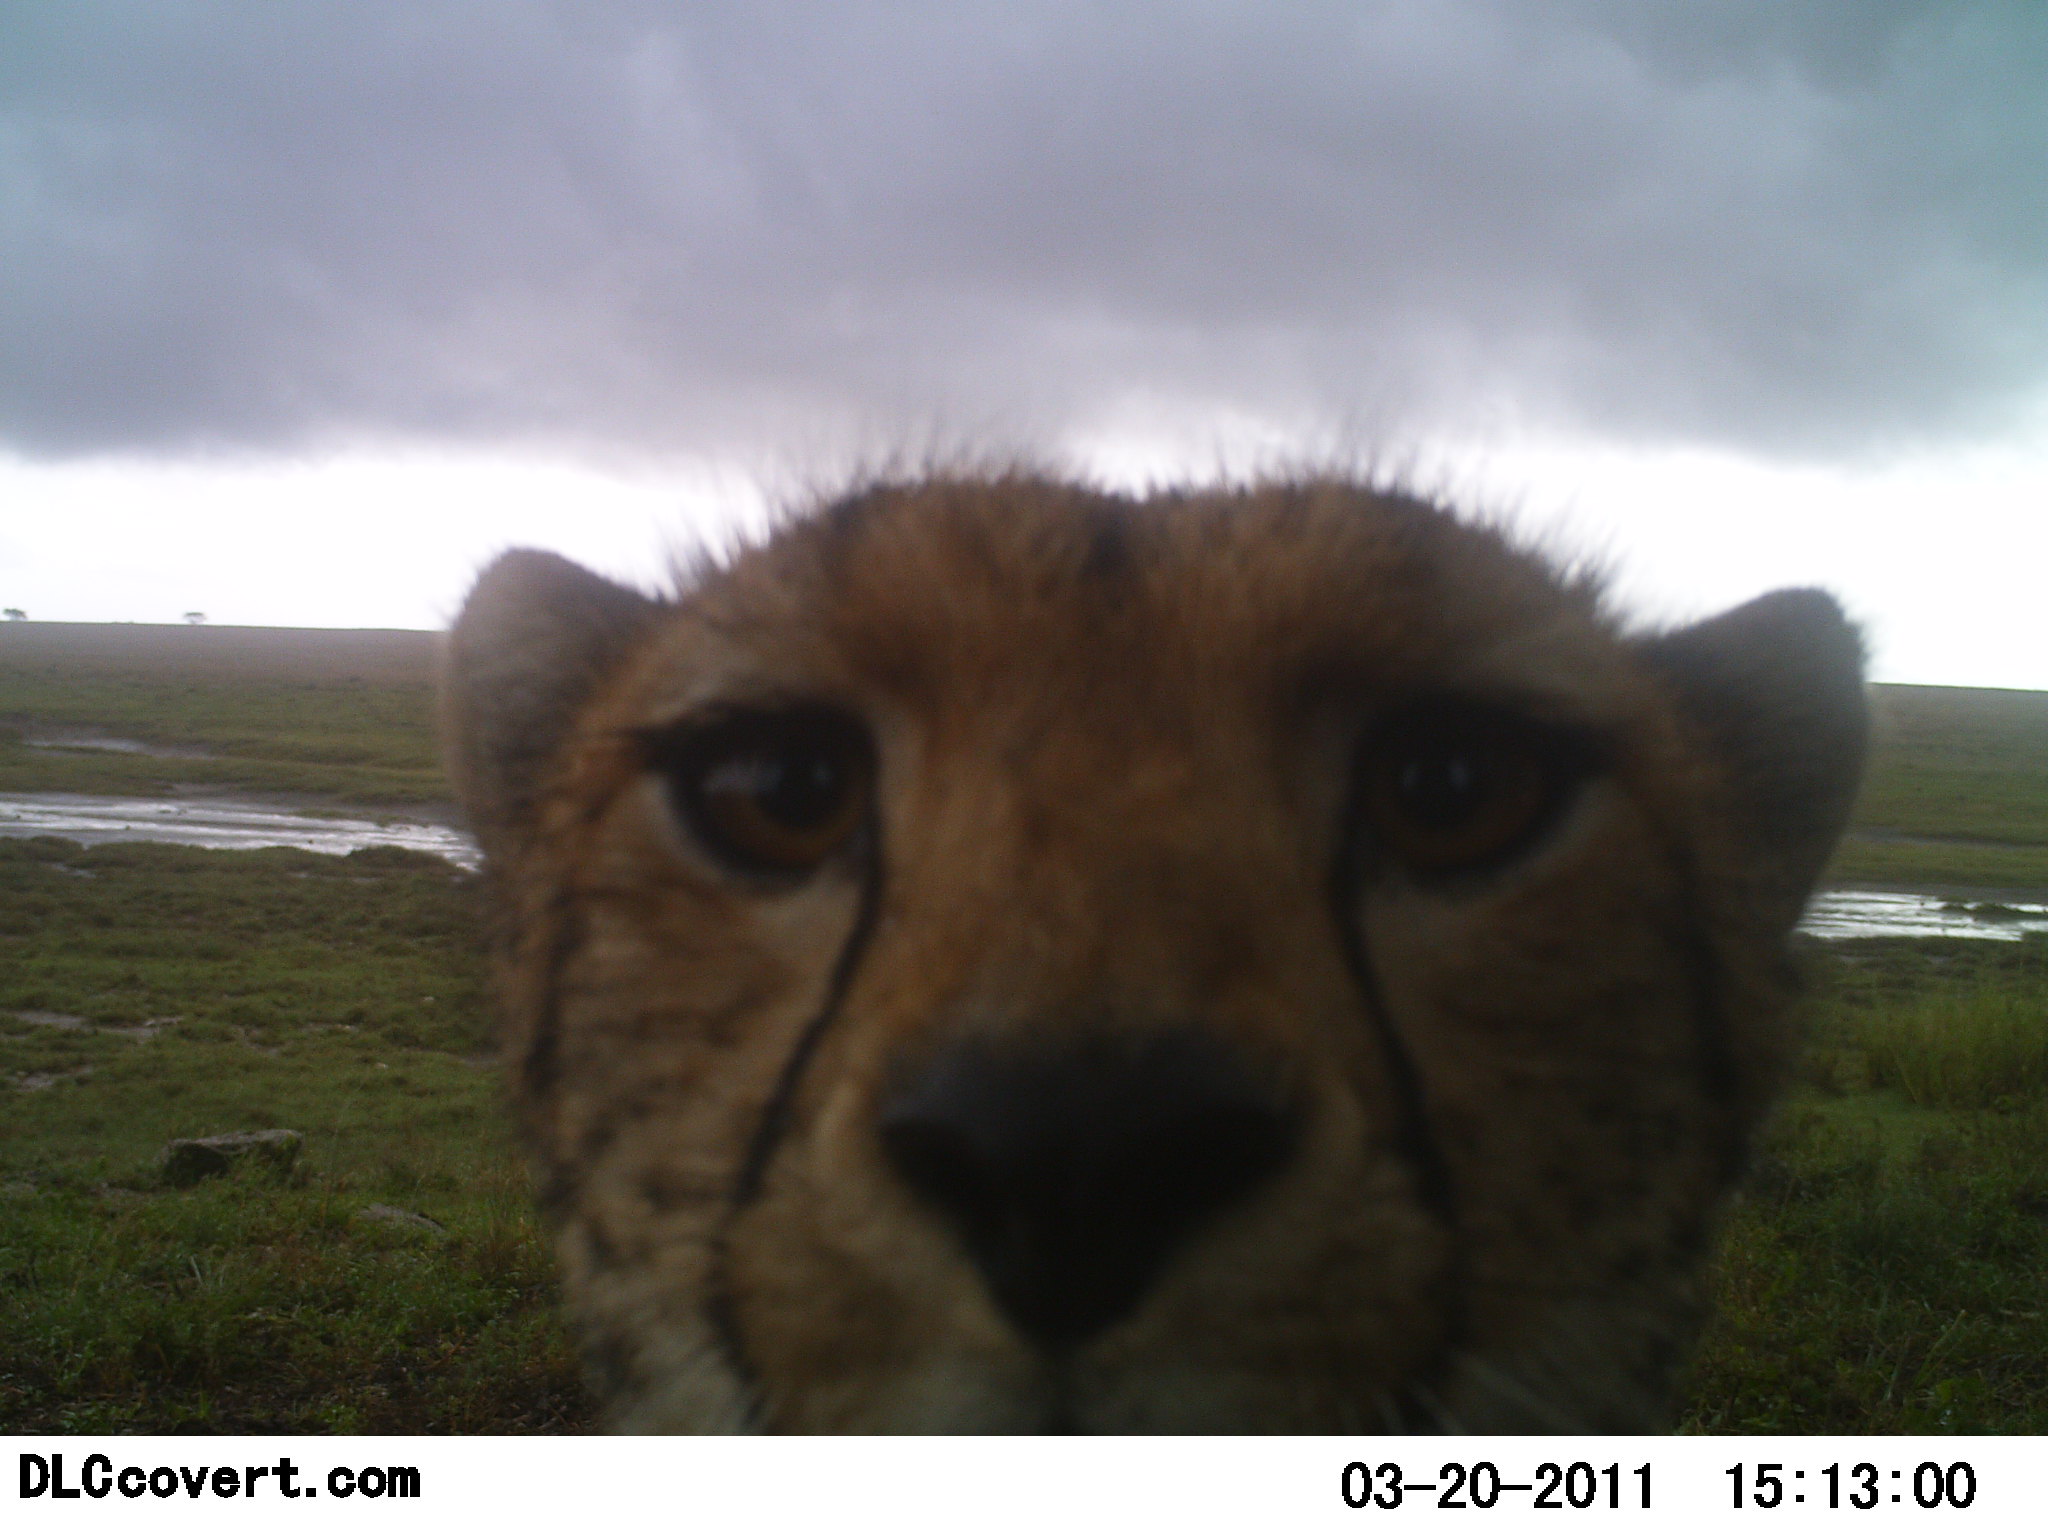
Fortunately, although researchers in other systems sometimes find trap-shy animals (baby tigers in Nepal, for example), our Serengeti animals don’t seem too bothered – at least not to the point where they avoid an area after encountering a camera trap. Even at night, with the flash firing away, we get photo after photo of the same bunch of playful lion cubs, or repeat visits by the same leopard, cheetah, lion, or hyena week after week.

Also, since the cameras aren’t baited, we don’t think that they’re drawn to the cameras from long distances. Instead, we think that once the animals are close to the camera, they come a little closer to investigate thoroughly.
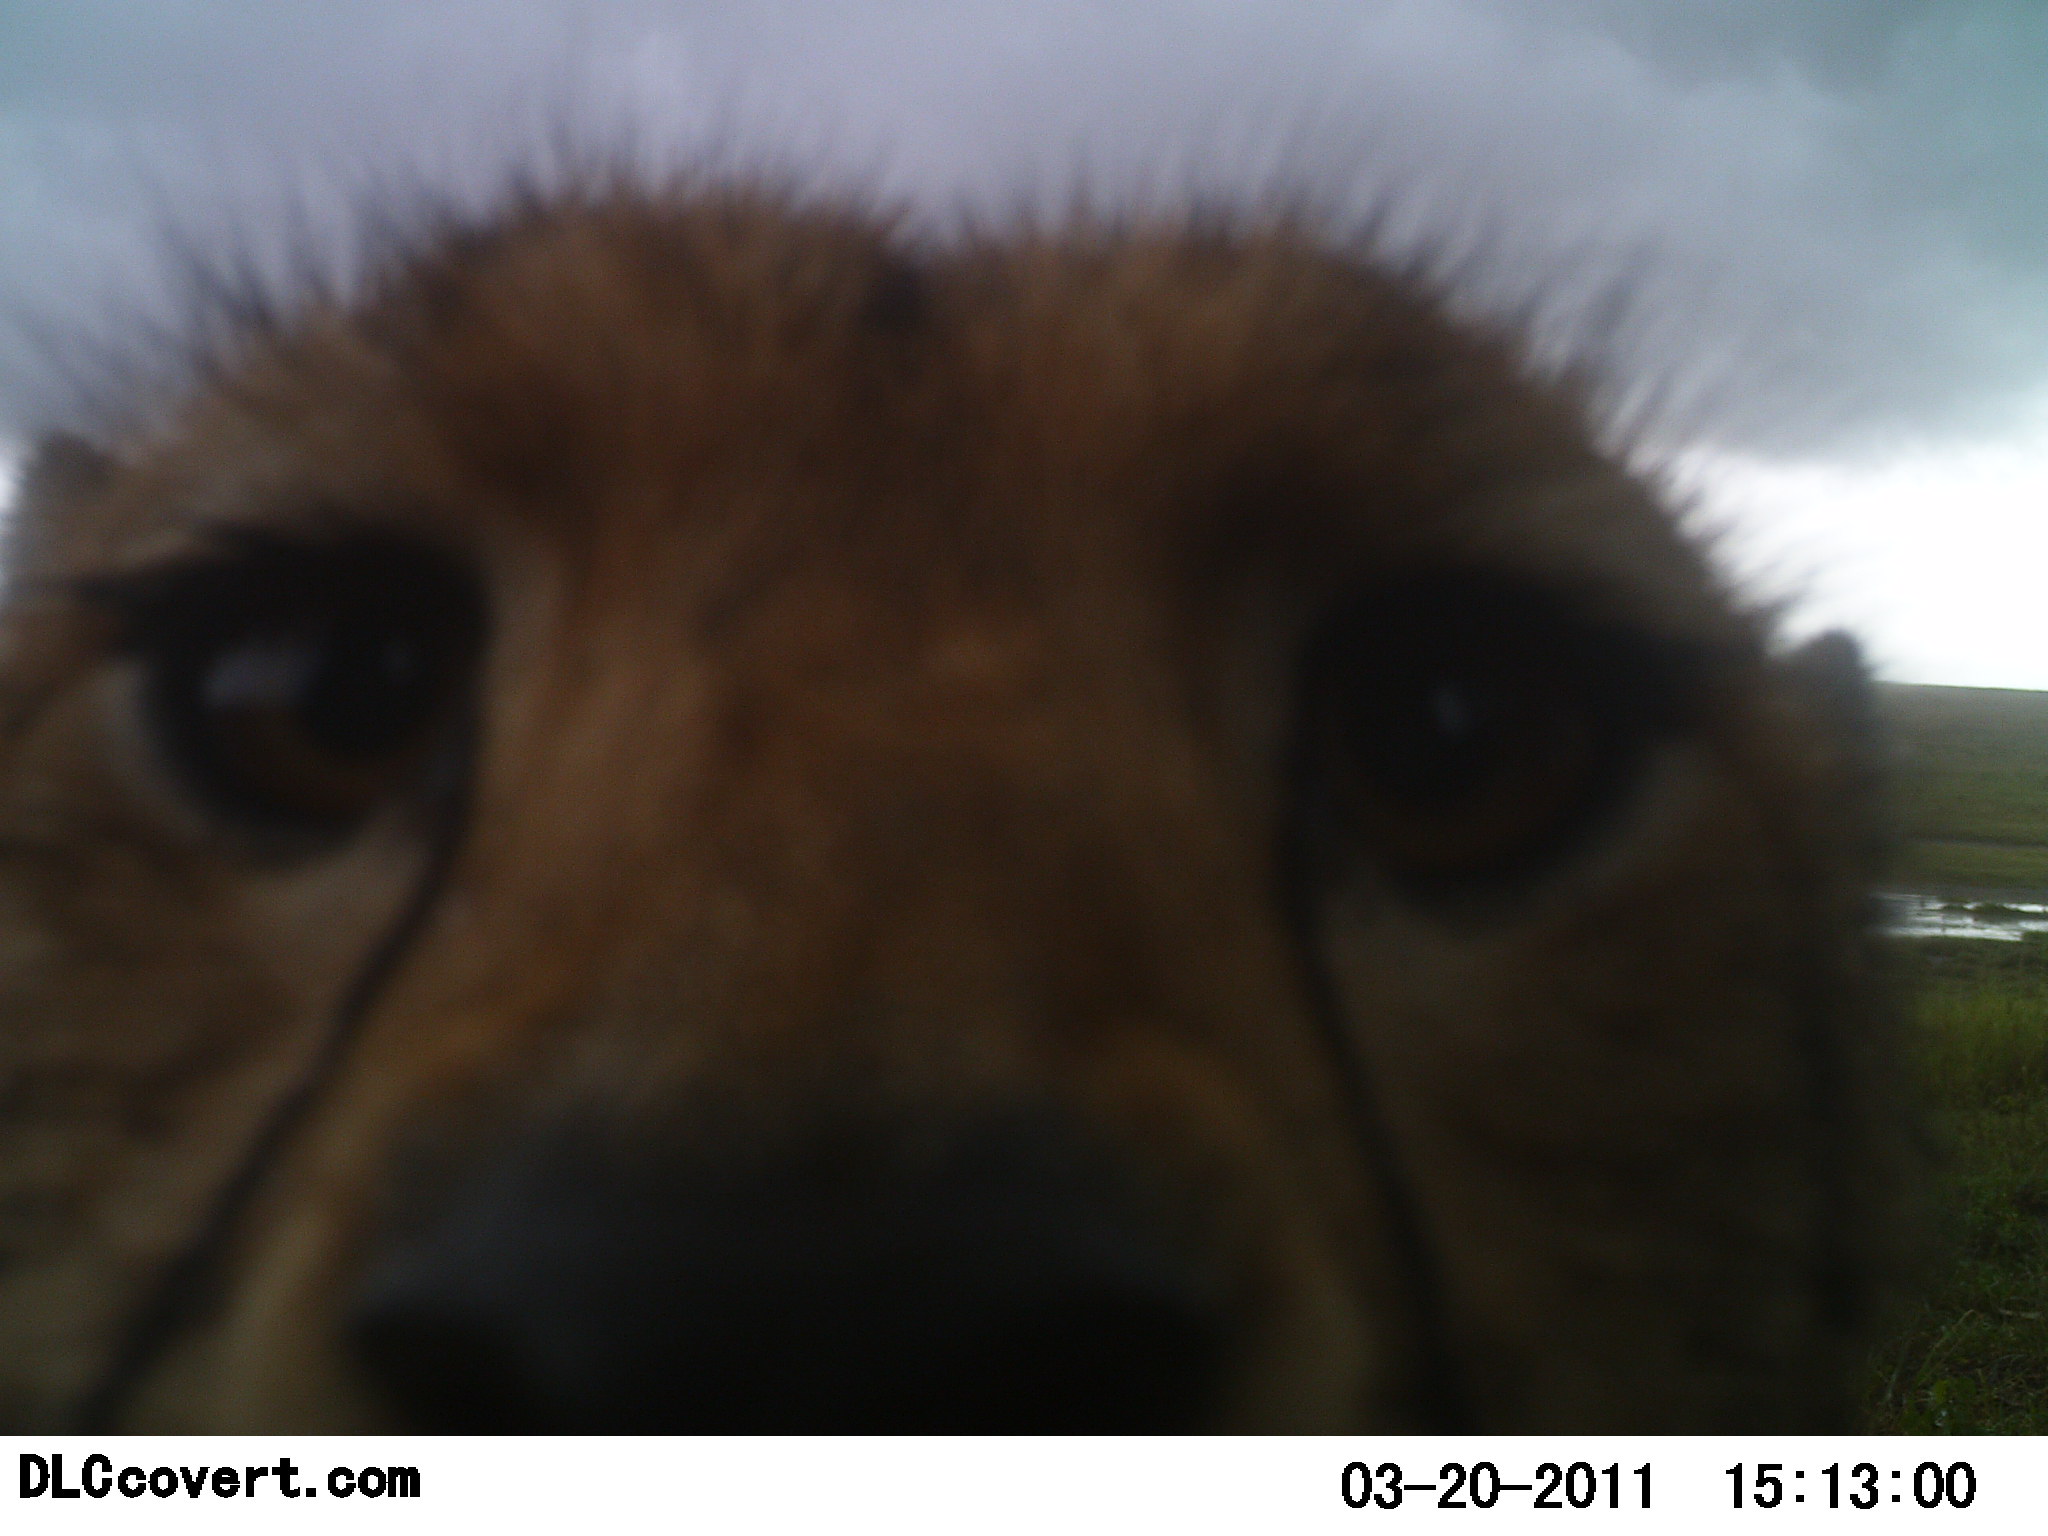
Hope you enjoy the view!
The Snaran Story
You may have seen a snapshot of the lion Snaran when you were classifying:

The Lion Project is familiar with the individual lions in the area where the camera traps are set up, and so we can give you Snaran’s back story. Craig Packer writes:
Field assistant Ingela Jansson first saw Snaran on 22-Sept 2009 together with three other males along the Ngare Nanyuki River in a favorite area for two of our long-term study prides, the Loliondos and the Young Transects. The four new males were all shy, but Ingela eventually managed to get close enough to take photos and note down their ear notches and whisker spots. These identifying marks are how we keep track of individuals. She named them Snaran (Snare in Swedish), Faran (Danger), Karan & Twaran (made-up names).
Snaran had a fresh large scar around his neck, obviously caused by a snare, but it was impossible to tell if the snare was still there. Eight days later, Ingela found Snaran and his three brothers together with the Loliondo females. Ingela asked a veterinarian to come dart Snaran with tranquilizer and treat his snare wound. No wire was found, so Snaran must have wounded his neck while pulling himself free from the snare.
A year or so later field assistant Daniel Rosengren asked the vets to handle Snaran a second time, because his wound wasn’t healing. They worried that a snare may still be well dug into his flesh, but a metal detector found nothing. Snaran has otherwise remained in good shape, and the four males have stayed on as resident males for both the Loliondo and Young Transect prides.
The camera trap snapshot of Snaran is from March 25, 2011. Comment on it on Snapshot Serengeti’s ‘Talk’ pages.
Data from Seasons 1, 2, and 3
Last week Michael Parrish sent me all your classifications for Seasons 1, 2, and 3. At 4,374,368 classifications, it’s going to take me a while to fully analyze them. Nevertheless, I’ve taken a first look through and am happy to give you some feedback.
Snapshot Serengeti volunteers classified 512,585 capture events. (We call a set of images a “capture event,” regardless of whether it consists of 1 or 3 images.) Of these capture events, 30% were from Season 1, 40% from Season 2, and 30% from Season 3. Based on your classifications, 72% of these capture events were “nothing here” and less surprisingly, Season 1 had the highest share of “nothing here” images. Season 1 was when Ali was still trying to figure out how to animal-proof the cameras and plenty of cameras got knocked off trees. I still have to double-check accuracy for these “nothing here” images, but suffice it to say that you guys classified a lot of blowing grass. Thanks for your perseverance!

And what about the Snapshot Serengeti community itself? I want to preface this by saying that in the data I get, all volunteers have been anonymized. That is, each user name has been replaced by a gibberish string of letters and numbers, so I don’t know who is who. I can tell you that we have 14,352 volunteers who created a user name. They provided us with 84% of the classifications; the rest were done by people who didn’t create – or hadn’t yet created – user names.
The median number of capture events classified by each logged-in volunteer was 63. I find that pretty awesome. In case you need a refresher on what the median is: imagine we put all 14,352 Snapshot Serengeti volunteers in a line according to how many capture events they had classified. Those that made just 1 classification would be on the far left end, and those that had classified thousands of capture events would be on the far right end. Then we would find the volunteer in the very middle of this line; she would be the 7176th volunteer from the left (7176 is half of 14,352). And we would ask how many classifications she had made. The answer would be 63; that is, half of all volunteers (on the left) made fewer than 63 classifications and half (on the right) made more than 63 classifications. Sixty-three classifications is no small number; you’ve got to be sitting there a while to do that many, and yet over 7,000 different people did so. Wow.
The most number of capture events made by one volunteer? 8,431. That’s just for Seasons 1, 2, and 3, so I’m betting that number is higher now that Season 4 is underway. The 5,000 Club is pretty exclusive: 23 of you classified more than 5,000 capture events in Seasons 1 through 3. The 1,000 Club has 829 members. And an astounding 5,777 people classified more than 100 capture events.
I continue to be amazed and humbled by your dedication to this project. Thank you.
