
What we’ve seen so far, cont’d.
Playing with data is one of the many things I love about research. Yes, it is super nerdy. I embrace that.
Last week I shared with you the various critters we’re getting to *see* in the Snapshot Serengeti data. Over 100,000 wildebeest photos! Over 4,000 lions! And the occasional really cool rarity like pangolins

Pangolin!
and rhinos.

Rhino!
But the photographs carry a lot more information than just simply what species was caught in the frame. For example, because the photos all have times recorded, we can see how the Serengeti changes through time.
This graph shows the number of daily pictures of wildebeest and buffalo, and how the daily capture rates change through the seasons. Each set of bars represents a different month, starting in July 2010. Wildebeest are in dark green, buffalo in light green. The y-axis is on a square-root scale, meaning that the top is kind of squished: the difference from 30-40 is smaller than the distance from 0-10. Otherwise, we’d either have to make the graph very very tall, or wouldn’t really be able to see the buffalo counts at all.

Buffalo are captured more-or-less evenly across the different months. But the wildebeest show vast spikes in capture rates during the wet season. These spikes in numbers coincide with the migration, when the vast herds of wildebeest come sweeping through the study area.
Now, the number of photos doesn’t directly transfer into the number of wildebeest in the study area, and these aren’t changes in population size, but instead changes in distribution of the wildebeest. But it’s pretty cool that with something as simple as just the number of photographs, we can see these huge changes that accurately reflect what’s going on in the system.
What we’ve seen so far…
As we prepare to launch Season 7 (yes! it’s coming soon! stay tuned!), I thought I’d share with you some things we’ve seen in seasons 1-6.
Snapshot Serengeti is over a year old now, but the camera survey itself has been going on since 2010; you guys have helped us process three years of pictures to date!
First, of the >1.2 million capture events you’ve looked through, about two-thirds were empty. That’s a lot of pictures of grass!

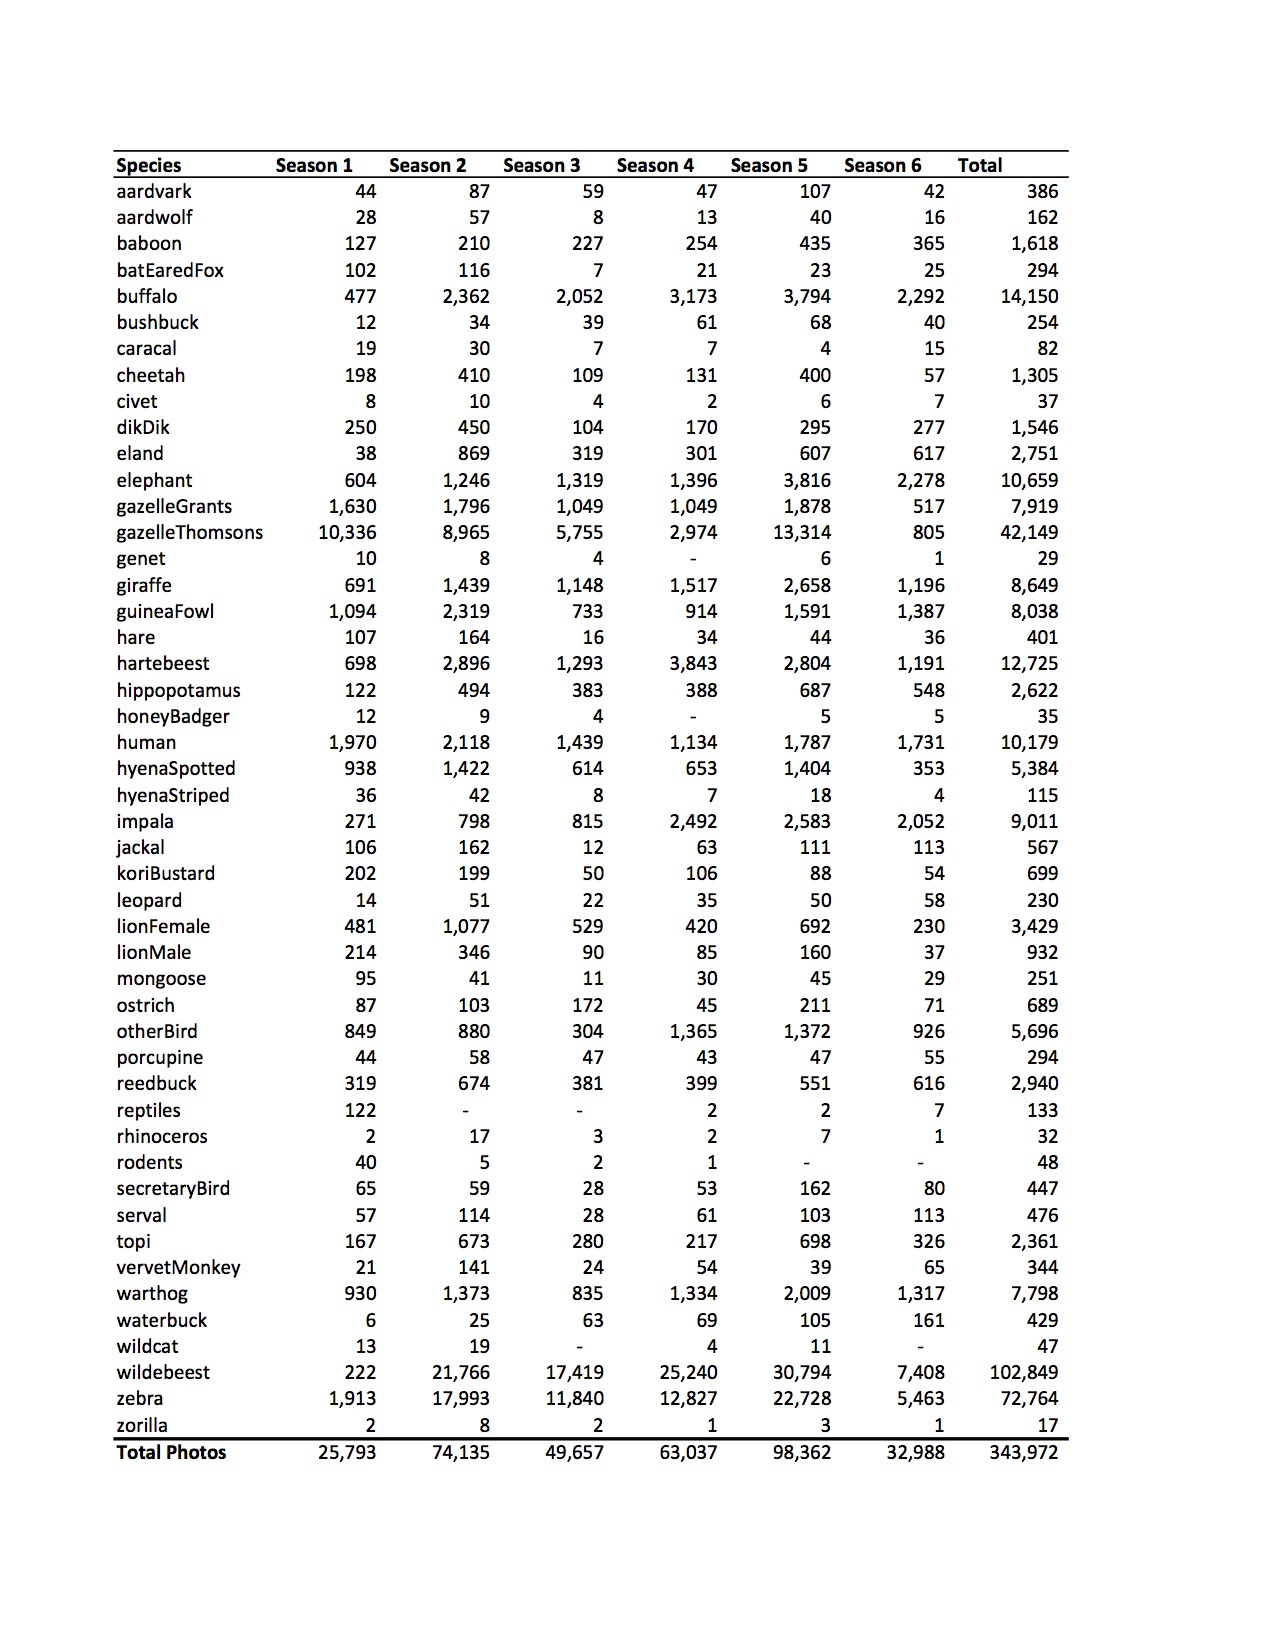
But about 330,000 photos are of the wildlife we’re trying to study. A *lot* of those photos are of wildebeest. From all the seasons so far, wildebeest made up just over 100,000 photos! That’s nearly a third of all non-empty images altogether.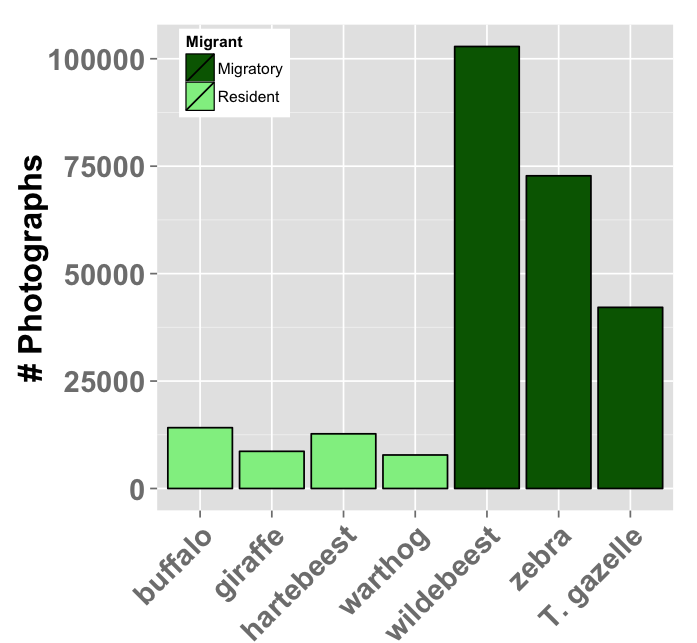
We also get a lot of zebra and gazelle – both of which hang out with the wildebeest as they migrate across the study area. We also see a lot of buffalo, hartebeest, and warthog — all of which lions love to eat.

We also get a surprising number of photos of the large carnivores. Nearly 5,000 hyena photos! And over 4,000 lion photos! (Granted, for lions, many of those photos are of them just lyin’ around.)
Curious what else? Check out the full breakdown below…
Big Cat Wars
I’m in the process of writing up some *really* cool camera trap results from Seasons 1-6, and plan to share them here next week (as soon as I make them pretty). It would never have been possible without your guys’ help. But in the meanwhile, this just aired again on TV, and thought you might enjoy a bit of a break! They talk about the camera traps a bit ~33 minutes in.
Snapshot Serengeti: Not *just* for procrastinating anymore…
That’s right. Even though many of us probably ID photos on Snapshot Serengeti because we really don’t feel like writing up that expense report or answering emails or formatting our bibliographies, Snapshot is also a fantastic tool for *deliberate* learning.
Check out how post-doctoral researcher Annika Moe has incorporated Snapshot Serengeti into college classrooms. It’s a pretty compelling argument for engaging students with authentic research — I’m just glad that Snapshot Serengeti got to be part of such a cool new approach to learning.
Just ask nicely
I don’t think this will work…
A cute article came out a few weeks ago in a one of the big methodological journals in my field. (Methods in Ecology and Evolution, published through the British Ecological Society.)
The article pointed out that researchers often have to leave equipment out in the field to collect data (sound familiar?), and that this equipment sometimes gets damaged or stolen. So they did a little experiment where they labeled the equipment with a note. The note was in one of three “tones”: personal, neutral, or threatening.
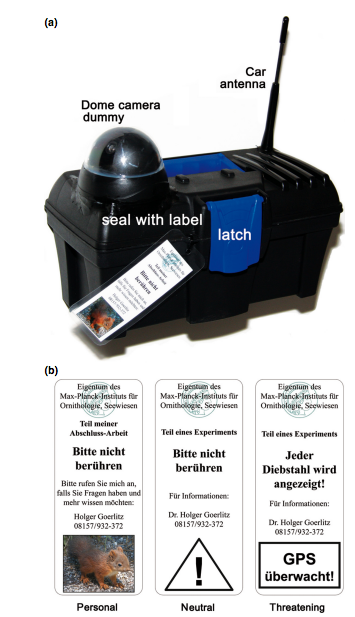
The equipment and labels used by Clarin et al. 2013.
The personal note read: ‘Part of my thesis – Please do not touch – Please call me if you have any questions and would like to know more:’ and a photograph of a juvenile squirrel.
The neutral note read: ‘Part of an experiment – Please do not touch’ and a warning sign.
And the threatening note: ‘Part of an experiment – Every theft will be reported to the police! GPS monitored!’
Lo and behold, cameras with the personal note and a picture of a cute baby squirrel had the fewest instances of vandalism and theft! (Also note in the chart below that the equipment with the “threatening” note had the most encounters!)
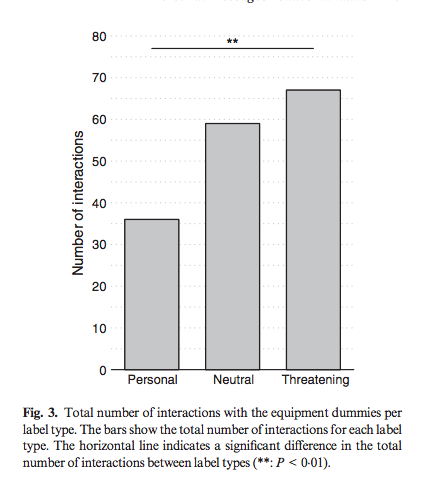
Figure 3 from Clarin et al, showing the # of incidents experienced by cameras with different note types.
I thought this experiment was fun and the results heartening. Unfortunately, though, I’m not so sure nice notes will work so well on the Serengeti wildlife…

The last picture *this* camera ever took…
Reference: Clarin, B.-M., Bitzilekis, E., Siemers, B.M. & Goerlitz, H.R. (2013) Personal messages reduce vandalism and theft of unattended scientific equipment. Methods in Ecology and Evolution, doi: 10.1111/2041-210X.12132.
The surprisingly powerful role of fear
Fear.
An unpleasant emotion caused by the belief that someone or something is dangerous, likely to cause pain, or a threat: — Oxford English Dictionary
Fear is an emotion induced by a perceived threat which causes entities to quickly pull far away from it and usually hide. — Wikipedia
To be afraid of (something or someone). To expect or worry about (something bad or unpleasant). To be afraid and worried. — (Not very helpful) Merriam-Webster.com
Both Meredith and I have talked a bit about the meaning and role of “fear” in shaping animal behaviors and population dynamics. The word “fear” is a bit touchy. When ecologists use the word fear, we aren’t talking about the emotion as you and I know it. We are referring to a certain type of situation and response. For example, lions kill and eat wildebeest. This creates “landscape of fear” – meaning that the wildebeest exists in a landscape in which certain physical places have a higher risk of predation. You can envision that this landscape has its own topography — hills and valleys of high and low risk. The differing levels of risk can trigger physiological responses as well as behavioral responses. For example, wildebeest may show higher levels of stress hormone in the “risky” areas, or they may avoid “risky” areas even though that’s where the best food is.
This is what we mean when we talk about fear. We are not talking about whether the wildebeest lies awake at night dreaming bad dreams. We are talking about situations of high and low risk and the physiological and behavioral responses.
That being said, “fear” is an incredibly powerful driving force in the natural world. I’ve touched on this from time to time. The idea that smaller predators are so desperate to avoid being beaten up by the big guys, that they avoid the areas with the best food or den sites, and their populations decline even if they aren’t actively being killed by the big guys. This process still amazes me. Even cooler? Fear doesn’t just matter for big and small predators, it doesn’t just matter for predators and prey. The effects of fear can trickle down from predators to prey to plants, just like the trophic cascades I wrote about last week.
Some of my favorite research on the role of fear in trophic cascades has been done by researchers out of the Schmitz Lab at Yale University.
In 1997, Os Schmitz and his students hypothesized that predators could trigger trophic cascades not just by killing and eating herbivores, but by scaring herbivores and changing their behaviors. Os, in his infinite wisdom, works in systems that are experimentally tractable. So he and his team got a bunch of spiders (their predator) and grasshoppers (their prey) and did an experiment that I will never ever be able to do with lions. They created two treatments: a risk treatment, where the spiders had their pincers glued shut and couldn’t kill the grasshoppers, and a predation treatment, where the spiders got to carry on with all the spidery things they like to do (such as eat grasshoppers). They put the grasshoppers in with one of the two types of spiders, and compared what happened.

How spiders affect grasshoppers affect plants. Excerpted from Schmitz et al. 1997.
So, perhaps unsurprisingly, grasshoppers were afraid of spiders whether or not the spiders had their mouths glued shut. In the presence of any spider, grasshoppers changed their diet to avoid areas that spiders liked to lurk, spent less time eating, and only really came out to eat when the spiders were sleeping. The surprising thing is that these behaviors resulted in lower grasshopper densities irrespective of whether or not the spiders could kill grasshoppers. The presence of spiders with their mouths glued shut changed the behavior of the grasshoppers, which resulted in the grasshoppers acquiring less food, which in turn decreased grasshopper populations. What’s more, these effects trickled down to the plant communities. Grasshoppers eat grass, but mere presence of predatory spiders can reduce the effect of grasshoppers on this grass.
Since this 1997 experiment, Os’s lab has gone on to produce some of my favorite research on the role of fear in driving ecological systems. Now if only I could figure out how do such enlightening experiments in the Serengeti…
Reference: Schmitz, O.J., Beckerman, A.P. & O’Brien, K.M. (1997) BEHAVIORALLY MEDIATED TROPHIC CASCADES: EFFECTS OF PREDATION RISK ON FOOD WEB INTERACTIONS. Ecology, 78, 1388–1399.
It’s all connected
A few weeks ago, I wrote about how losing top predators from ecosystems can produce effects that radiate throughout the ecosystem, and talked a bit about how sea otters provide one of the better known of these examples. Today I want to talk a bit more about these reverberating consequences and how they come about.
These patterns are known as “tropic cascades.” Derived from the Greek word for “food”, trophic refers to the position that a species occupies in a food web. Plants consume sunlight. Herbivores consume plants. Carnivores consume herbivores (and sometimes other carnivores). Some carnivores, like bears, are really omnivores — eating both other animals as well as plants. So, things in one trophic level typically consume things from a lower trophic level. And critters within a trophic level compete with other critters in that trophic level for resources — sunlight, water, food, whatever. Trophic cascades are when changes in one trophic level (say, the top carnivores) have effects that cascade down to affect herbivores and plants.
The ways in which these cascades can happen are many and complex. The classic example describes how sea otters protect kelp forests by keeping sea urchin populations low. Without otters, the sea urchin populations explode and eat all of the kelp. But this is just one story of just one pathway.
For example, research on the Aleutian Islands reveals that foxes can change island grasslands into tundra. The islands provide a fantastic natural experiment, because 19th century fur traders brought foxes to some islands but not others, creating a whole pile of very similar islands, some with, and some without, foxes. On islands without foxes, seabirds eat fish from the sea and and…deposit…the nutrients from those fish on land (yes, in the form of droppings). All of the nitrogen and phosphorous in seabird droppings provide the nutrients to support long, lush grasses. But foxes reduce seabird populations, which in turn reduces the influx of nutrients to the islands, an results in a very different tundra-like plant community.
One of my favorite recent papers is a 2011 Science review by Dr. Jim Estes and colleagues that documents the many and complex changes that apex predators trigger in natural systems. This figure from the Estes et al. publication gives us a tiny hint of just how complex these pathways are.
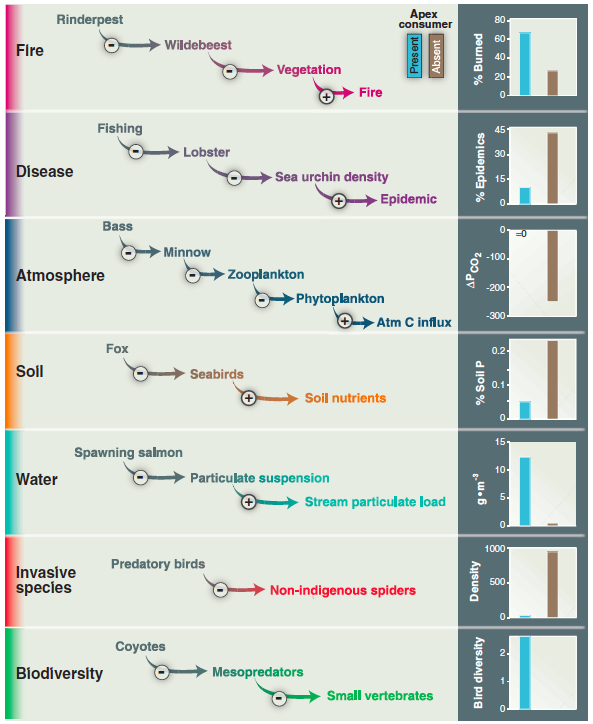
A figure from Estes et al. 2011 documenting the various pathways in which the loss of a top consumer affects many other things. For example, in this last row, coyotes suppress mesopredators (smaller predators). Mesopredators suppress small vertebrates. So losing coyotes means more mesopredators and thus fewer small vertebrates. The blue bar shows high levels of biodiversity in systems with coyotes. The brown bar, which is so low it’s invisible, indicates that in systems without coyotes, biodiversity is really, really low.
You can see from this figure that it’s not only predators that have reverberating consequences for the larger ecosystem. In the late 1800s, a disease called rinderpest decimated wildebeest populations. This led to increased woody vegetation and increased incidence of savanna wildfires, When wildebeest populations recovered, their grazing patterns transformed the Serengeti back into a grassland and reduced the fuel available for wildfires. Fires since then are far fewer and far less intense.
So there are many, many ways in which one species can have cascading effects on the larger system. You can hear Jim talk more about the paper here.
Ultimately, we’re left with two profound and lingering realizations. The first is that everything inside an ecosystem is connected to everything else in a complex web of interactions. Sometimes shaking this web doesn’t do much, but sometimes losing a species from this web can have dramatic and unexpected effects. Everything is connected to everything else. The second realization is that people are inexorably changing the shape of these webs as they exist in the natural world. Because of their large body size, need for large spaces and lots of food, and tendency to come into conflict with people, large predators are one of the first things to go in human dominated landscapes. With everything connected to everything else, we don’t yet know what the extent of these losses will be.
What we still don’t know
Just a pretty picture that makes me wonder what on *earth* I am doing in the polar vortex…
Weather.com says it’s a whopping 6 degrees outside right now, but that it feels like -14. I am really wishing I were back at the conference in California right now…
By now, both Meredith and I have gushed about all the “bio-celebrities” at the Gordon Research Conference on Predator Prey Interactions. How we got to come face to face with the scientists whose work we’ve read, memorized, admired for years. But what I think has been an even more exciting outcome of this research conference than getting to hang out with our scientific heros and listen awe-struck about everything they’ve done in the past that has led to their fame today, was a chance to sit down with them over a beer or glass of overpriced red, and talk about the future. Not just where our various and varied subfields have been, and not even just where they are going, but where they need to go. Where the holes are in our knowledge, and what we need to do to fill them.
Much of ecology is about developing “predictive capacity.” The ability to not just describe the patterns we see in the world about us, but the ability to predict what will happen when things change. Understanding how climate change affects annual bird migrations, for example, or what losing species means for the spread of disease. We develop conceptual frameworks to tie together outcomes from different experiments and scattered observations drawn from ecosystems around the world, and these frameworks give us a way to articulate our expectations about 1) what underlying processes we think are driving the dynamics of a system and 2) a way to test those hypotheses: do the outcomes match what we predicted would happen? Or is something else going on that we need to investigate further?
One of the things I slowly worked up the courage to articulate at the conference was that I think that science surrounding predator-predator dynamics really lacks this sort of integrated, synthetic, predictive framework. We draw on a whole bunch of different sets of theories to understand the patterns of suppression and coexistence apparent in apex-mesopredator (top- and middle- predator) systems. There’s a ton of theory out there on how species coexist when they eat the same thing, or how they coexist when they eat the same thing and also eat each other. There’s a lot of theory on how predators coexist with the things they eat. There are predictions for when we expect to see species able to coexist, when we don’t, and how these different outcomes change from, say, low productivity tundra to high productivity rainforests.
But around the world, top predators suppress populations of smaller predators (called mesopredator suppression). It’s not because the top predators are eating up all the food, and it’s not because the top predators are eating the mesopredators. It seems to happen because the bigger guys chase, harass, and kill the smaller guys. This is bad enough, but it also creates a “landscape of fear” in which that the smaller guys change their behaviors to try and avoid these aggressive encounters. There are lots and lots of ways in which mesopredator suppression can happen…but we (as a community of ecologists) don’t have a good, integrated framework for making predictions about when we expect to see mesopredator suppression vs. when we don’t. We don’t have a set of expectations about how these patterns change with different behaviors or different types of environments. We don’t have a solid understanding of what mesopredator suppression means for other small predators, prey animals, and the plants that the prey animals eat. We have lots and lots of examples of all sorts of complex things happening…but we don’t yet have the ability to predict how these things play out in new systems.
And that, to me, is one of the most exciting “holes” that needs filling. How do we tie together our knowledge from all of these disparate studies, where lions suppress wild dogs but not cheetahs, or coyotes kill foxes left and right but aren’t actually the reason that fox populations are low. I guess my PhD is trying to fill a tiny, tiny bit of that hole. But it’s a damn big hole and sometimes it’s hard to see how one PhD will cover a whole lot of ground. I guess what was so exciting at the GRC is just how many other people are also trying to fill those holes…and with all of us working together, we just might actually be able to understand the world around us that much better.
Man-eaters
## Today’s blog is a guest post from Craig Packer, the director of the Serengeti Lion project. ##
In the summer of 2006, I sent my 19-yr old son, Jonathan, and 18-yr old step-daughter, Carrie down to the land of man-eating lions with my graduate students, Hadas Kushnir and Dennis Ikanda. They crossed the Rufiji River every day in dugout canoes to collect data on lion attacks from previous years, dodging hippos and crocodiles in the slow moving waters.
Cell phone coverage in Rufiji was sparse, so Jonathan only sent the occasional message:
A woman and a child were attacked last night in a village we had visited two days ago. they’re both recovering in hospital. 26-June-2006 18:31:15
Rufiji is just outside the Selous Game Reserve, Tanzania’s largest protected area, and the Selous is reputed to be the home of the largest lion population in Africa. There was a signboard near the site where a man-eater named Osama had been shot after killing 40 people, and things had been relatively quiet for the past few years. But more lions were starting to appear, and Hadas and Dennis wanted to figure out how people could protect themselves in the event of future outbreaks.
Dennis had recruited a couple of staff from the Wildlife Division in Dar es Salaam for the first big man-eating survey in September 2004. Dennis drove south towards Rufiji while Bernard headed west towards Dodoma. As soon as they reached the outskirts of Dar they were already in man-eating country.
They spent three weeks on the road, passing through dozens of agricultural villages that had suffered lion attacks, covering the coastal Tanzanian districts as far as the Mozambique border then up the west side of the Selous, visiting sites where attacks had taken place as long as 15 yrs ago, as recently as last week.
No one ever forgot a lion attack. Survivors relived their experiences as if they’d only been attacked the night before. Relatives of victims still felt the loss as keenly as if their loved ones might miraculously walk in through the front door.
I had helped Dennis design a questionnaire, and each survey team asked the circumstances of each attack, the location, time of day, time of year. They also asked which prey species the lions might be eating in the vicinity. Were there still any zebra or buffalo? Anything at all?
I sat down with Dennis in December 2004 and studied the data. Most lion attacks took place in the wet season, at harvest time, and most of the attacks were in agricultural districts where there was nothing else for the lions to eat – no wildebeest or buffalo, no zebra or impala.
Most attacks occurred when lions pulled someone out from a temporary hut or dungu – usually just a simple A-framed roof above a raised platform a meter or two off the ground. These people were subsistent farmers with a single crop per year; their lives depended on a good harvest, and crop pests could quickly destroy an unguarded field – especially at night.
The worst man-eating areas lacked the lion’s usual prey species, but there was an abundance of one particular crop pest. The bush pig turned out to be the magnet that drew lions to the farm fields, right into the areas where people slept in their flimsy huts. The worst hit areas were mostly Muslim, so people were unwilling to touch a pig – and there was no market for bush pork.
People might also be attacked while walking home alone in the dark or heading off to Mosque at dawn. People might be pulled out of bed, and kids might be attacked while playing around the house in the evening.
But we suspect these were later victims of lions that first saw the connection between people and food once they had been drawn to the fields by the bush pigs.
Pig control is impossible. No one will ever eradicate the bush pigs from rural Tanzania – no one will ever be able to fence off all their fields – but we thought it might be possible to find an alternative way to reduce pig damage so that people wouldn’t have to sleep in a dungu.
So Jonathan and Carrie went to Rufiji in 2006 to help Dennis and Hadas. Hadas was born in Israel, and the kids were frustrated to be left in the care of such a determined mother hen. And Dennis was driving the same clapped-out Land Rover he had used when he was my field assistant in Ngorongoro Crater. So their most memorable adventures seemed to involve wild rides, steering rods and duct tape. I was worried about money, so I was half hoping our impending college expenses might be avoided with the help of a hungry lion…
A day in the life of a camera
Okay, okay, it’s actually more like 2 months in the life of the camera, but I strung selected images together for site M08, Season 4, “roll 2.”
It’s actually pretty cool. It amazes me just how much information we get on even a single camera. We can see the migration moving through, the grass greening up, and even a spat between lions and hyenas!
My next task will be to string *all* of the images together for the season, but there are >2,000 of them, which my little computer couldn’t quite handle just yet.
