
Handling difficult images
From last week’s post, we know that we can identify images that are particularly difficult using information about classification evenness and the fraction of “nothing here” votes cast. However, the algorithm (and really, all of you volunteers) get the right answer even on hard images most of the time. So we don’t necessary want to just throw out those difficult images. But can we?
Let’s think about two classes of species: (1) the common herbivores and (2) carnivores. We want to understand the relationship between the migratory and non-migratory herbivores. And Ali is researching carnivore coexistence. So these are important classes to get right.
First the herbivores. Here’s a table showing the most common herbivores and our algorithm’s results based on the expert-classified data of about 4,000 images. “Total” is the total number of images that our algorithm classified as that species, and “correct” is the number of those that our experts agreed with.
| species | migratory | total | correct | % correct |
| wildebeest | yes | 1548 | 1519 | 98.1% |
| zebra | yes | 685 | 684 | 100% |
| hartebeest | no | 252 | 244 | 96.8% |
| buffalo | no | 219 | 215 | 98.2% |
| gazelleThomsons | yes | 200 | 189 | 94.5% |
| impala | no | 171 | 168 | 98.3% |
We see that we do quite well on the common herbivores. Perhaps we’d wish for Thomsons gazelles to be a bit higher (Grants gazelles are most commonly mis-classified as Thomsons), but these results look pretty good.
If we wanted to be conservative about our estimates of species ranges, we could throw out some of the images with high Pielou scores. Let’s say we threw out the 10% most questionable wildebeest images. Here’s how we would score. (Note that I didn’t do the zebra, since they’d be at 100% again, no matter how many we dropped.) The columns are the same as the above table, except this time, I’ve listed the threshold Pielou score used to throw out 10% of the images of that species.
| species | Pielou cutoff | total | correct | % correct |
| wildebeest | 0.60 | 1401 | 1389 | 99.1% |
| hartebeest | 0.73 | 228 | 223 | 97.8% |
| buffalo | 0.76 | 198 | 198 | 100% |
| gazelleThomsons | 0.72 | 180 | 175 | 97.2% |
| impala | 0.86 | 155 | 153 | 98.7% |
We do quite a bit better with our Thomsons gazelle and increase the accuracy of all the other species at least a little. But do we sacrifice anything throwing out data like that? If wildebeest make up a third of our images and we have a million images, then we’re throwing away 33,000 images(!), but we still have another 300,000 left to do our analyses. One thing we will look at in the future is how much dropping the most questionable images affects estimates of species ranges. I’m guessing that for wildebeest it won’t be much.
What if we did the same thing for Thomsons gazelle or impala? We would expect about 50,000 images of each of those per million images. Throwing out 5,000 images still leaves us with 45,000, which seems like it might be enough for many analyses.
Now let’s look at the carnivore classifications from the expert-validated data set:
| species | total | correct | % correct |
| hyenaSpotted | 55 | 55 | 100% |
| lionFemale | 18 | 18 | 100% |
| cheetah | 6 | 6 | 100% |
| serval | 6 | 6 | 100% |
| leopard | 3 | 3 | 100% |
| jackal | 2 | 2 | 100% |
| lionMale | 1 | 1 | 100% |
| aardwolf | 1 | 1 | 100% |
| batEaredFox | 1 | 0 | 0% |
| hyenaStriped | 1 | 0 | 0% |
Wow! You guys sure know your carnivores. The two wrong answers were the supposed bat-eared fox that was really a jackal and the supposed striped hyena that was really an aardwolf. These two wrong answers had high Pielou scores: 0.77 and 0.83 respectively.
Judging by this data set, about 2.5% of all images are carnivores, which gives us about 25,000 carnivore images for every million we collect. That’s a lot of great data on these relatively rare animals! But it’s not so much that we want to throw any of it away. Fortunately, we won’t have to. We can use the Pielou score to have an expert look at the most difficult images.
Let’s say Ali wants to be very confident of her data. She can choose the 20% most difficult carnivore images — which is only about 5,000 per million images, and she can go through them herself. Five thousand images is nothing to sneeze at, of course, but the work can be done in a single day of intense effort.
In summary, we might be able to throw out some of the more difficult images (based on Pielou score) for the common herbivores without losing much coverage in our data. Further analyses are needed, though, to see if doing so is worthwhile and whether we lose anything by throwing out so many correct answers. For carnivores, the difficult images can be narrowed down sufficiently that an expert can double-check them by hand.
Craig at Bryant Lake Bowl TONIGHT
If you’re in the Twin Cities area, Craig will be giving a Café Scientifique talk (“The Short and Happy Life of a Serengeti Lion”) at the Bryant Lake Bowl at 7pm tonight.
If you’ve never been to one, the Café Scientifique talks are loads of fun. They’re informal presentations by scientists in a bar setting. Eat, drink, laugh, science. Can’t get much better than that.
Elles in the night
## I’m currently on a mini-holiday in the Minnesota wilderness (Boundary Waters Canoe Area). As I’ve lately been missing long mornings on the porch watching Serengeti wildlife, and Margaret wrote a recent post on one of the all-time most-watchable animals out there, I thought I’d share a story of a late-night elephant encounter from my first year in the field. I was in the car with Candida, a Lion Project Field assistant, and Philipp Henschel, a lion researcher for Panthera who has spent years working in west Africa, and the man who taught me how to camera trap, when we came across this…#
As we hurtled along the gutted road, we came face to face with a herd of elephants paying their respects to a fallen buffalo. At first, in the murk of night, we thought they huddled around one of their own, and concerned silence fell upon us. Ellies, for as aggressive as they can sometimes be, have earned our admiration and careful respect. They seem to me intelligent and emotional creatures; where they are not persecuted, they tolerate the roar of our passing engine with a casual glance. But they are supposedly nearsighted to the point of legal blindness*. In heavily hunted areas we are sometimes charged by a protective female, but as we hold our breaths and brace for impact, they stop their charge short and listen…but give up and turn away. If we remain downwind in silence we are invisible…or so we hope.
The elephants tonight are agitated as they mill around the buffalo. Philipp tells us that ellies often investigate death in the forests where he’s worked. In an eerie display of some sort of cognizance, they seem to recognize that something is not right and come to look at fallen creatures. When they come across the bones of one of their own, he says, they pick them up and carry them away. It is sad and scary and moving and beyond my comprehension, what must be going on in the heads of these big, gray, lumbering beasts.
The two tour vehicles that are blocking the watering hole eventually pull away, and the ellies step forward to drink. They cluster close, pressing together side by side. Hesitant lions slowly creep back to reclaim their half-eaten kill, and the matriarch whirls around, her ears flaring, watching the lions in a silent stand-off. The air is still. It is thick with tension and heavy with the severity of the moment. One ill-timed thud against the car window or a frightened squeal from any of us, and we could incited a rampage. Silence is imperative and we hold our breaths as the ellies file past within inches of our landrover.We can almost feel their fear and my heart twists as I wonder what it must be like to stumble blindly through a blurry world, sensing death and its bearers all around you lurking in the hazy shadows and around every corner. As they disappear into the acacias, we hear a long, lumpy-sounding elephant fart and giggle nervously. We can breathe again.
We drive closer to the buffalo carcass and watch the lions return. In the faint starlight, we see that an adult female has already resumed her demolition; her whole head disappears inside the opened belly to rip solid tracts of muscle from the ribcage. We fumble for our headlamps and cameras; I look around optimitistically for an onslaught of hyenas. I have yet to see them challenge a lion kill, and begin to question the feasibility of my research plans. The subadult males pad around our car, their massive paws falling silently in the sandy soil. They are full, and are now studying us. Our windows are open, as always, and we glance around with slight unease – where did the two subadult males go? Suddenly we hear a loud chomp from the back of our vehicle. Fearing that they’ve gone of one of our tires, and hardly in any position to fix a flat, we frantically turn the car ignition and pull a few meters forward. In the sideview mirror, we see a lion trot into the darkness with our plastic tire cover dangling from his teeth. Candida’s jaw drops. We are not quite sure what inspired them to steal such an inedible adornment, but it is late and we have company coming that night. So we chalk the loss up to a casualty of the field…and as we drive home along the corrugated dirt road, we remind ourselves that at least we are better off than the buffalo.

*Elephants do have pretty bad vision, but it’s not as bad as I believed it was on this ominous night at the buffalo kill.
Introducing Meredith
Please welcome Meredith Palmer, a new graduate student with us here in the Lion Lab at the University of Minnesota. Meredith is joining our Snapshot Serengeti science team, so you’ll be hearing more from her as she gets settled in. In her first blog post here, she gives us a glimpse into the work she’s been doing the past several years. — Margaret
—
I hear the “ragged jean” look is still cool with young people these days, but when I slip into my black hoodie with the ripped up sleeve, it’s not to make a fashion statement. Rather, it serves to remind me of a time several years ago when I was last in Africa. This particular jacket once fell afoul of a rambunctious pair of orphaned lion cubs, and I must admit that I’m looking forward to the time when I once again will be sacrificing perfectly good clothing during the call of field duty.
Joining the Lion Lab is my opportunity to work with the giant accumulation of behavioral and camera trap data, supplemented by my own work in the Serengeti, which will enable me to elucidate some of the mechanisms involved in savanna predator-prey dynamics. I’m a first-year grad student, freshly back in school after spending the last several years working on science projects in various corners of the globe. I’ve had the good fortune to have spent time in Africa, Central and South America, the Caribbean, and even a brief stint on the island of Borneo! I’ve come straight to the University of Minnesota from the South Pacific, and the disparity between the warm tropical air I’m used to and the cool Twin Cities mornings is almost (almost!) makes me wish that I had a jacket that wasn’t full of holes…
My previous work in Africa has for the most part taken place in the southern portion of the continent. I stepped foot into Namibia five years ago to work for the Cheetah Conservation Fund (CCF). Cheetahs were having a particularly bad time, as they were considered – unjustly, in almost all cases – by local farmers to be a substantial source of livestock losses and were persecuted accordingly. We did a substantial amount of work on education and outreach with the people in the surrounding communities, but I would be lying if I didn’t say the exciting part for me was the work we did out in the bush. Shivering in the cold during 24hr water-hole watches, spitting out dust as we sped along in the back of a Toyota conducting large herbivore surveys, and of course, interacting the with the population of injured and rehabilitating cheetahs maintained on the reserve were the highlights of my experience.
I returned to Africa after I graduated college and helped to manage large herbivore populations at a safari reserve in the Limpopo region of South Africa. This area is right outside of the famous Kruger National Park and abounds with much of the same wildlife. It was here that I drove my first stick-shift, ate my first warthog, and spent many an evening sitting on top of a kopje drinking sundowners and watching the stars come out over the African plains. I had the opportunity to camp out in the Kruger Park and met characters involved in African conservation at all levels. I later migrated to the other side of the country to take a job in the Succulent Karoo. This was a desert landscape, loomed over by weirdly rounded hills and covered, during the springtime, in the most gorgeous blanket of wildflowers that I have ever encountered.
That being said, I simply can’t articulate how much I am looking forward to working again in the savanna ecosystem and getting a chance to glean some good data out of Snapshot Serengeti!
Certainty score
Back in June, I wrote about algorithms I was working on to take the volunteer data and spit out the “correct” classification of for each image. First, I made a simple majority-rules algorithm and compared its results to several thousand classifications done by experts. Then, when the algorithm came up with no answer for some of the images (because there were no answers in the majority), I tried a plurality algorithm, which just looked to see which species got the most votes, even if it didn’t get more than half the votes. It worked well, so I’m using the plurality algorithm going forward.
One of the things I’ve been curious about is whether we can detect when particular images are “hard.” You know what I mean by hard: animals smack up in front of the camera lens, animals way back on the horizon, animals with just a tip of the ear or a tuft of tail peeking onto the image from one side, animals obfuscated by trees or the dark of night.
So how can we judge “hard”? One way is to look at the “evenness” of the volunteer votes. Luckily, in ecology, we deal with evenness a lot. We frequently want to know what species are present in a given area. But we also want to know more than that. We want to know if some species are very dominant in that area or if species are fairly evenly distributed. For example, in a famous agricultural ecology paper*, Cornell entomologist Richard Root found that insect herbivore (pest) species on collard greens were less even on collards grown in a big plot with only other collards around versus on those grown in a row surrounded by meadow plants. In other words, the insect species in the big plot were skewed toward many individuals of just a few species, whereas in the the meadow rows, there were a lot more species with fewer individuals of each species.
We can adopt a species evenness metric called “Pielou’s evenness index” (which, for you information theorists, is closely related to Shannon entropy.)
[An aside: I was surprised to learn that this index is named for a woman: Dr. Evelyn Chrystalla Pielou. Upon reflection, this is the first time in my 22 years of formal education (in math, computer science, and ecology) that I have come across a mathematical term named for a woman. Jacqueline Gill, who writes a great paleo-ecology blog, has a nice piece honoring Dr. Pielou and her accomplishments.]
Okay, back to the Pielou index: we can use it to judge how even the votes are. If all the votes are for the same species, we can have high confidence. But if we have 3 votes for elephant and 3 votes for rhino and 3 votes for wildebeest and 3 votes for hippo, then we have very low confidence. The way the Pielou index works out, a 0 means all the votes are for the same species (high skew, high confidence) and a 1 means there are at least two species and they all got the same number of votes (high evenness, low confidence). Numbers in between 0 and 1 are somewhere between highly skewed (e.g. 0.2) and really even (e.g. 0.9).
Another way we could measure the difficulty of an image is to look at how many people click “nothing here.” I don’t like it, but I suspect that some people use “nothing here” as an “I don’t know” button. Alternatively, if animals are really far away, “nothing here” is a reasonable choice. We might assume that the percentage of “nothing here” votes correlates with the difficulty of the image.
I calculated the Pielou evenness index (after excluding “nothing here” votes) and the fraction of “nothing here” votes for the single-species images that were classified by experts. And then I plotted them. Here I have the Pielou index on the x-axis and the fraction of “nothing here” votes on the y-axis. The small pink dots are the 3,775 images that the algorithm and the experts agreed on, the big blue dots are the 84 images that the plurality algorithm got wrong, and the open circles are the 29 images that the experts marked as “impossible.” (Click to enlarge.)
 And sure enough, we see that the images the algorithm got wrong had relatively high Pielou scores. And the images that were “impossible” had either high Pielou scores or a high fraction of “nothing here” votes (or both). I checked out the four anomalies over on the left with a Pielou score of zero. All four were unanimously voted as wildebeest. For the three “impossibles,” both Ali and I agree that wildebeest is a reasonable answer. But Ali contends that the image the algorithm got wrong is almost certainly a buffalo. (It IS a hard image, though — right up near the camera, and at night.)
So we do seem to be able to get an idea of which images are hardest. But note that there are a lot more correct answers with high Pielou scores and high “nothing here” fractions than errors or “impossibles”. We don’t want to throw out good data, so we can’t just ignore the high-scorers. But we can attach a measure of certainty to each of our algorithm’s answers.
—
The best view is from a balloon
Don’t get me wrong – it’s really nice to have running water, internet, and my pick of fresh vegetables from the weekend farmer’s market. But sometimes I miss the Serengeti. Watching from my window in Minnesota, I’m lucky if I see a squirrel. And let’s face it — squirrels are only so exciting, for so long.
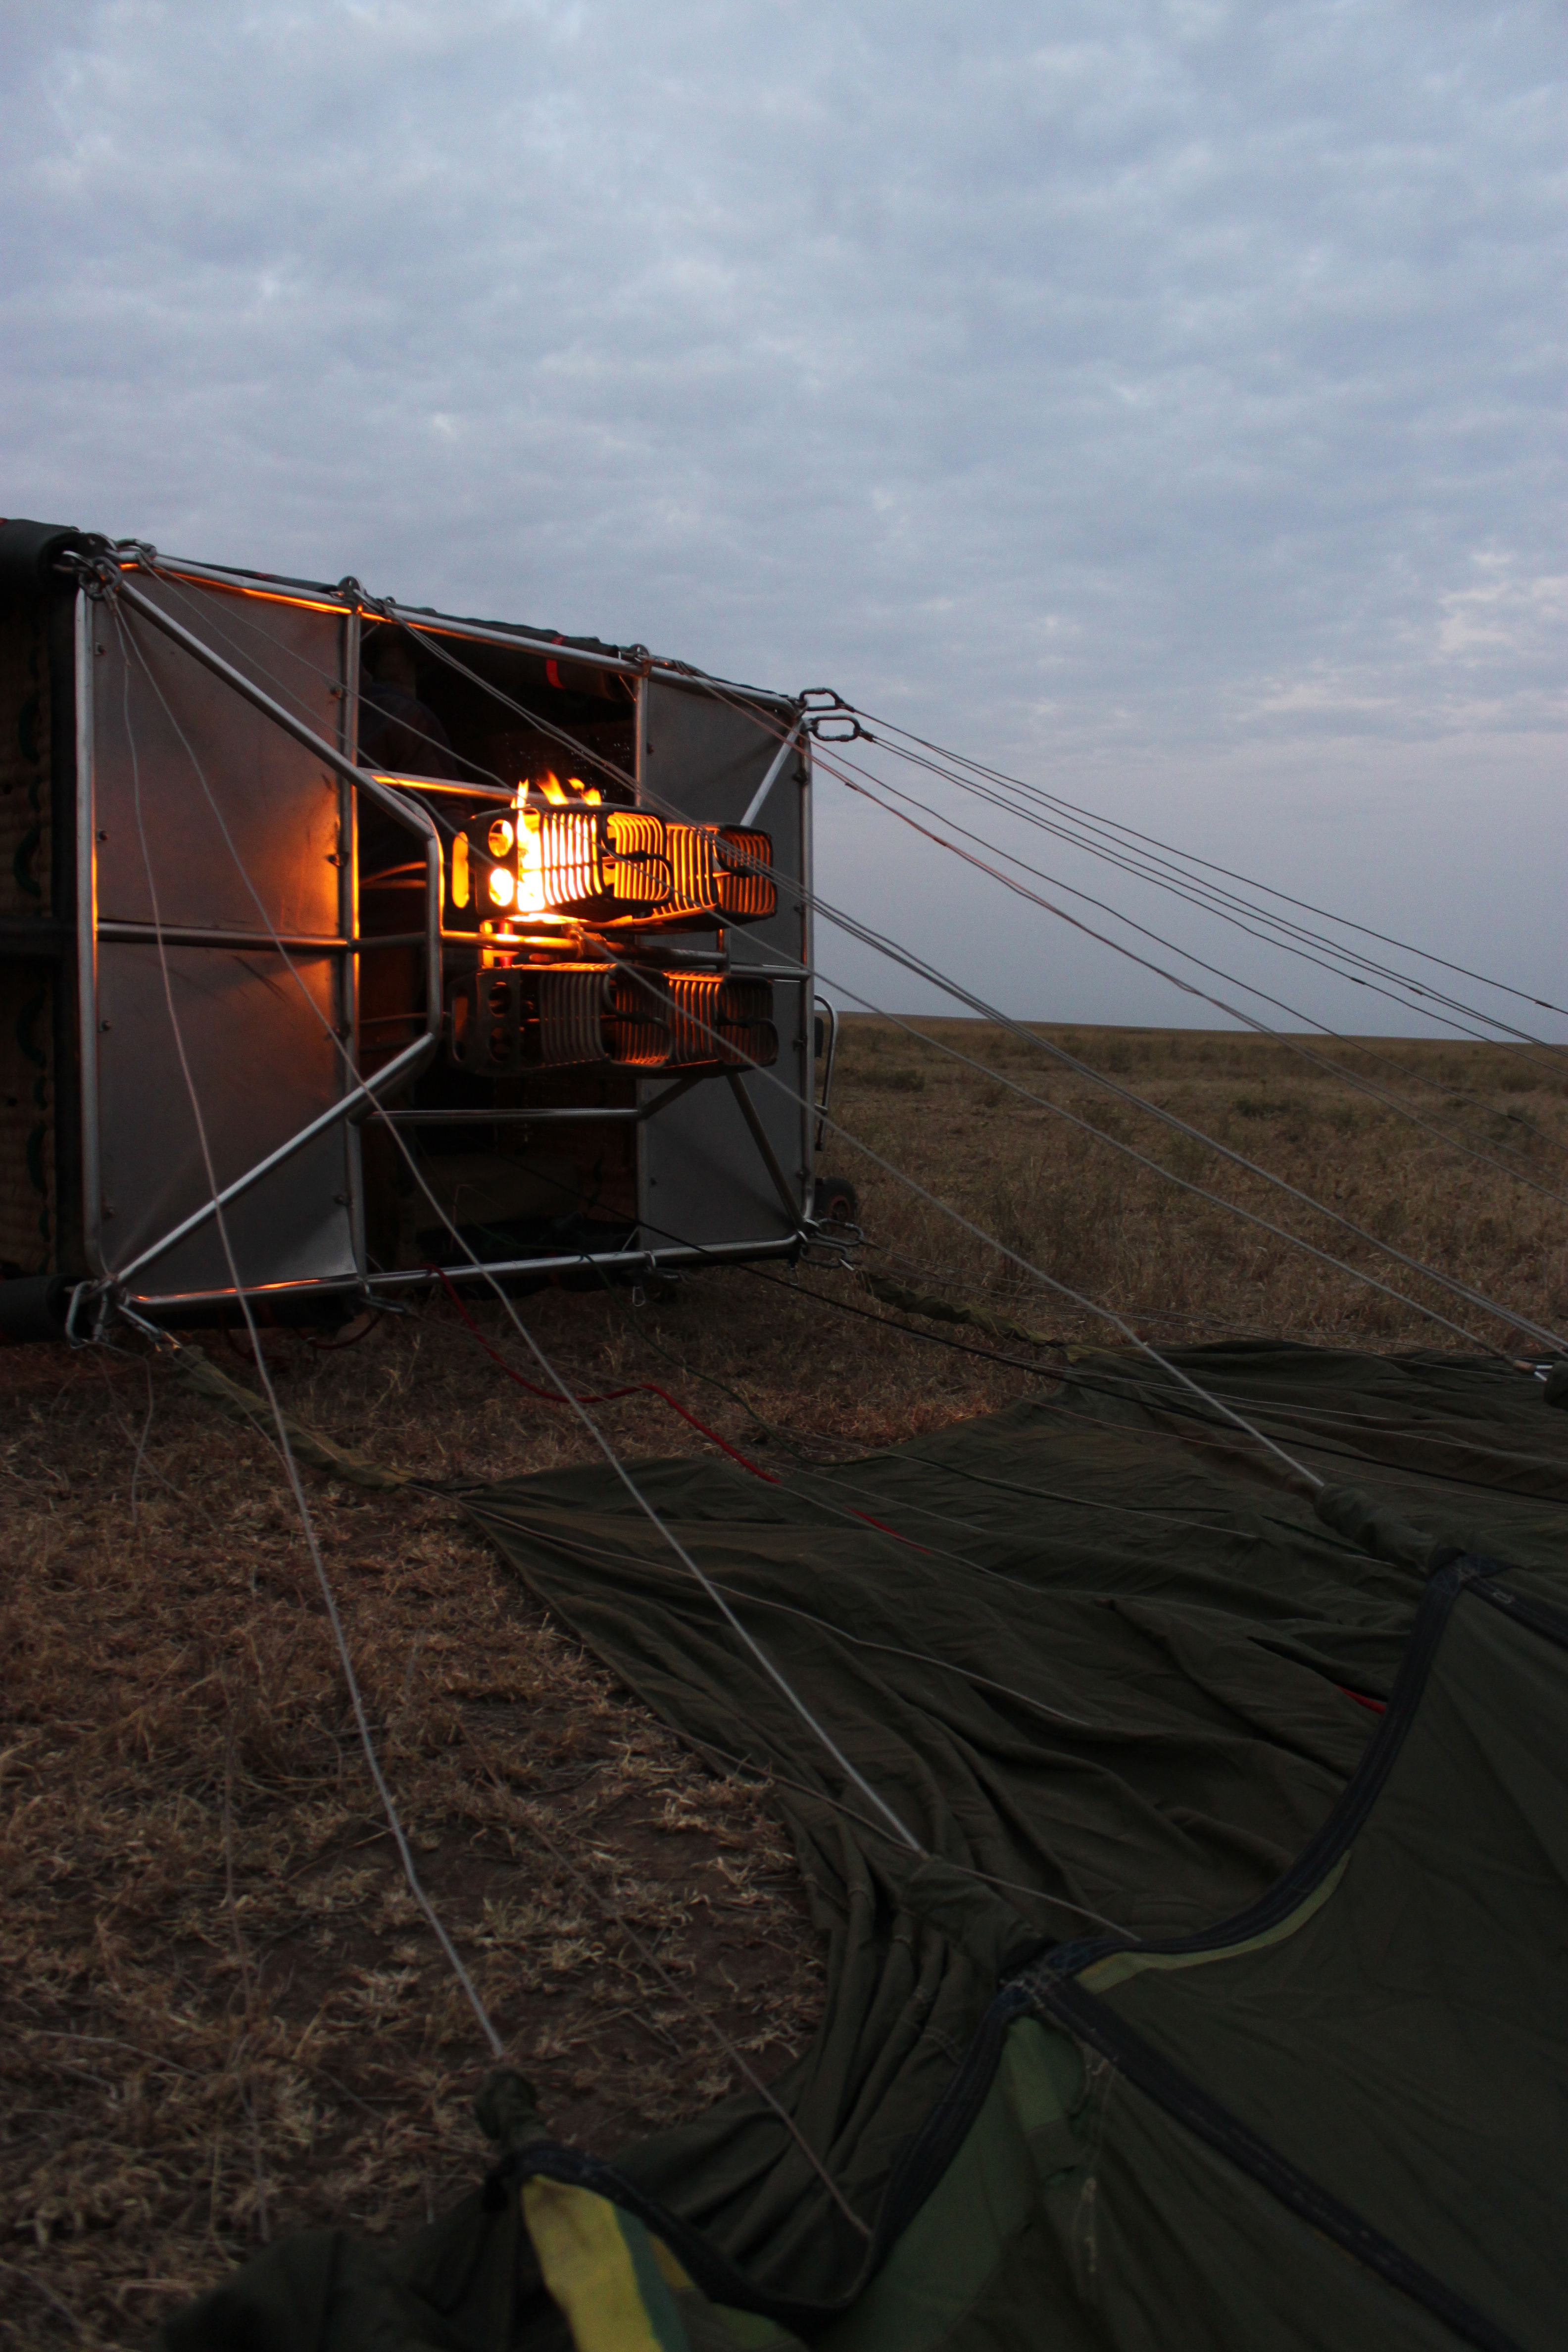
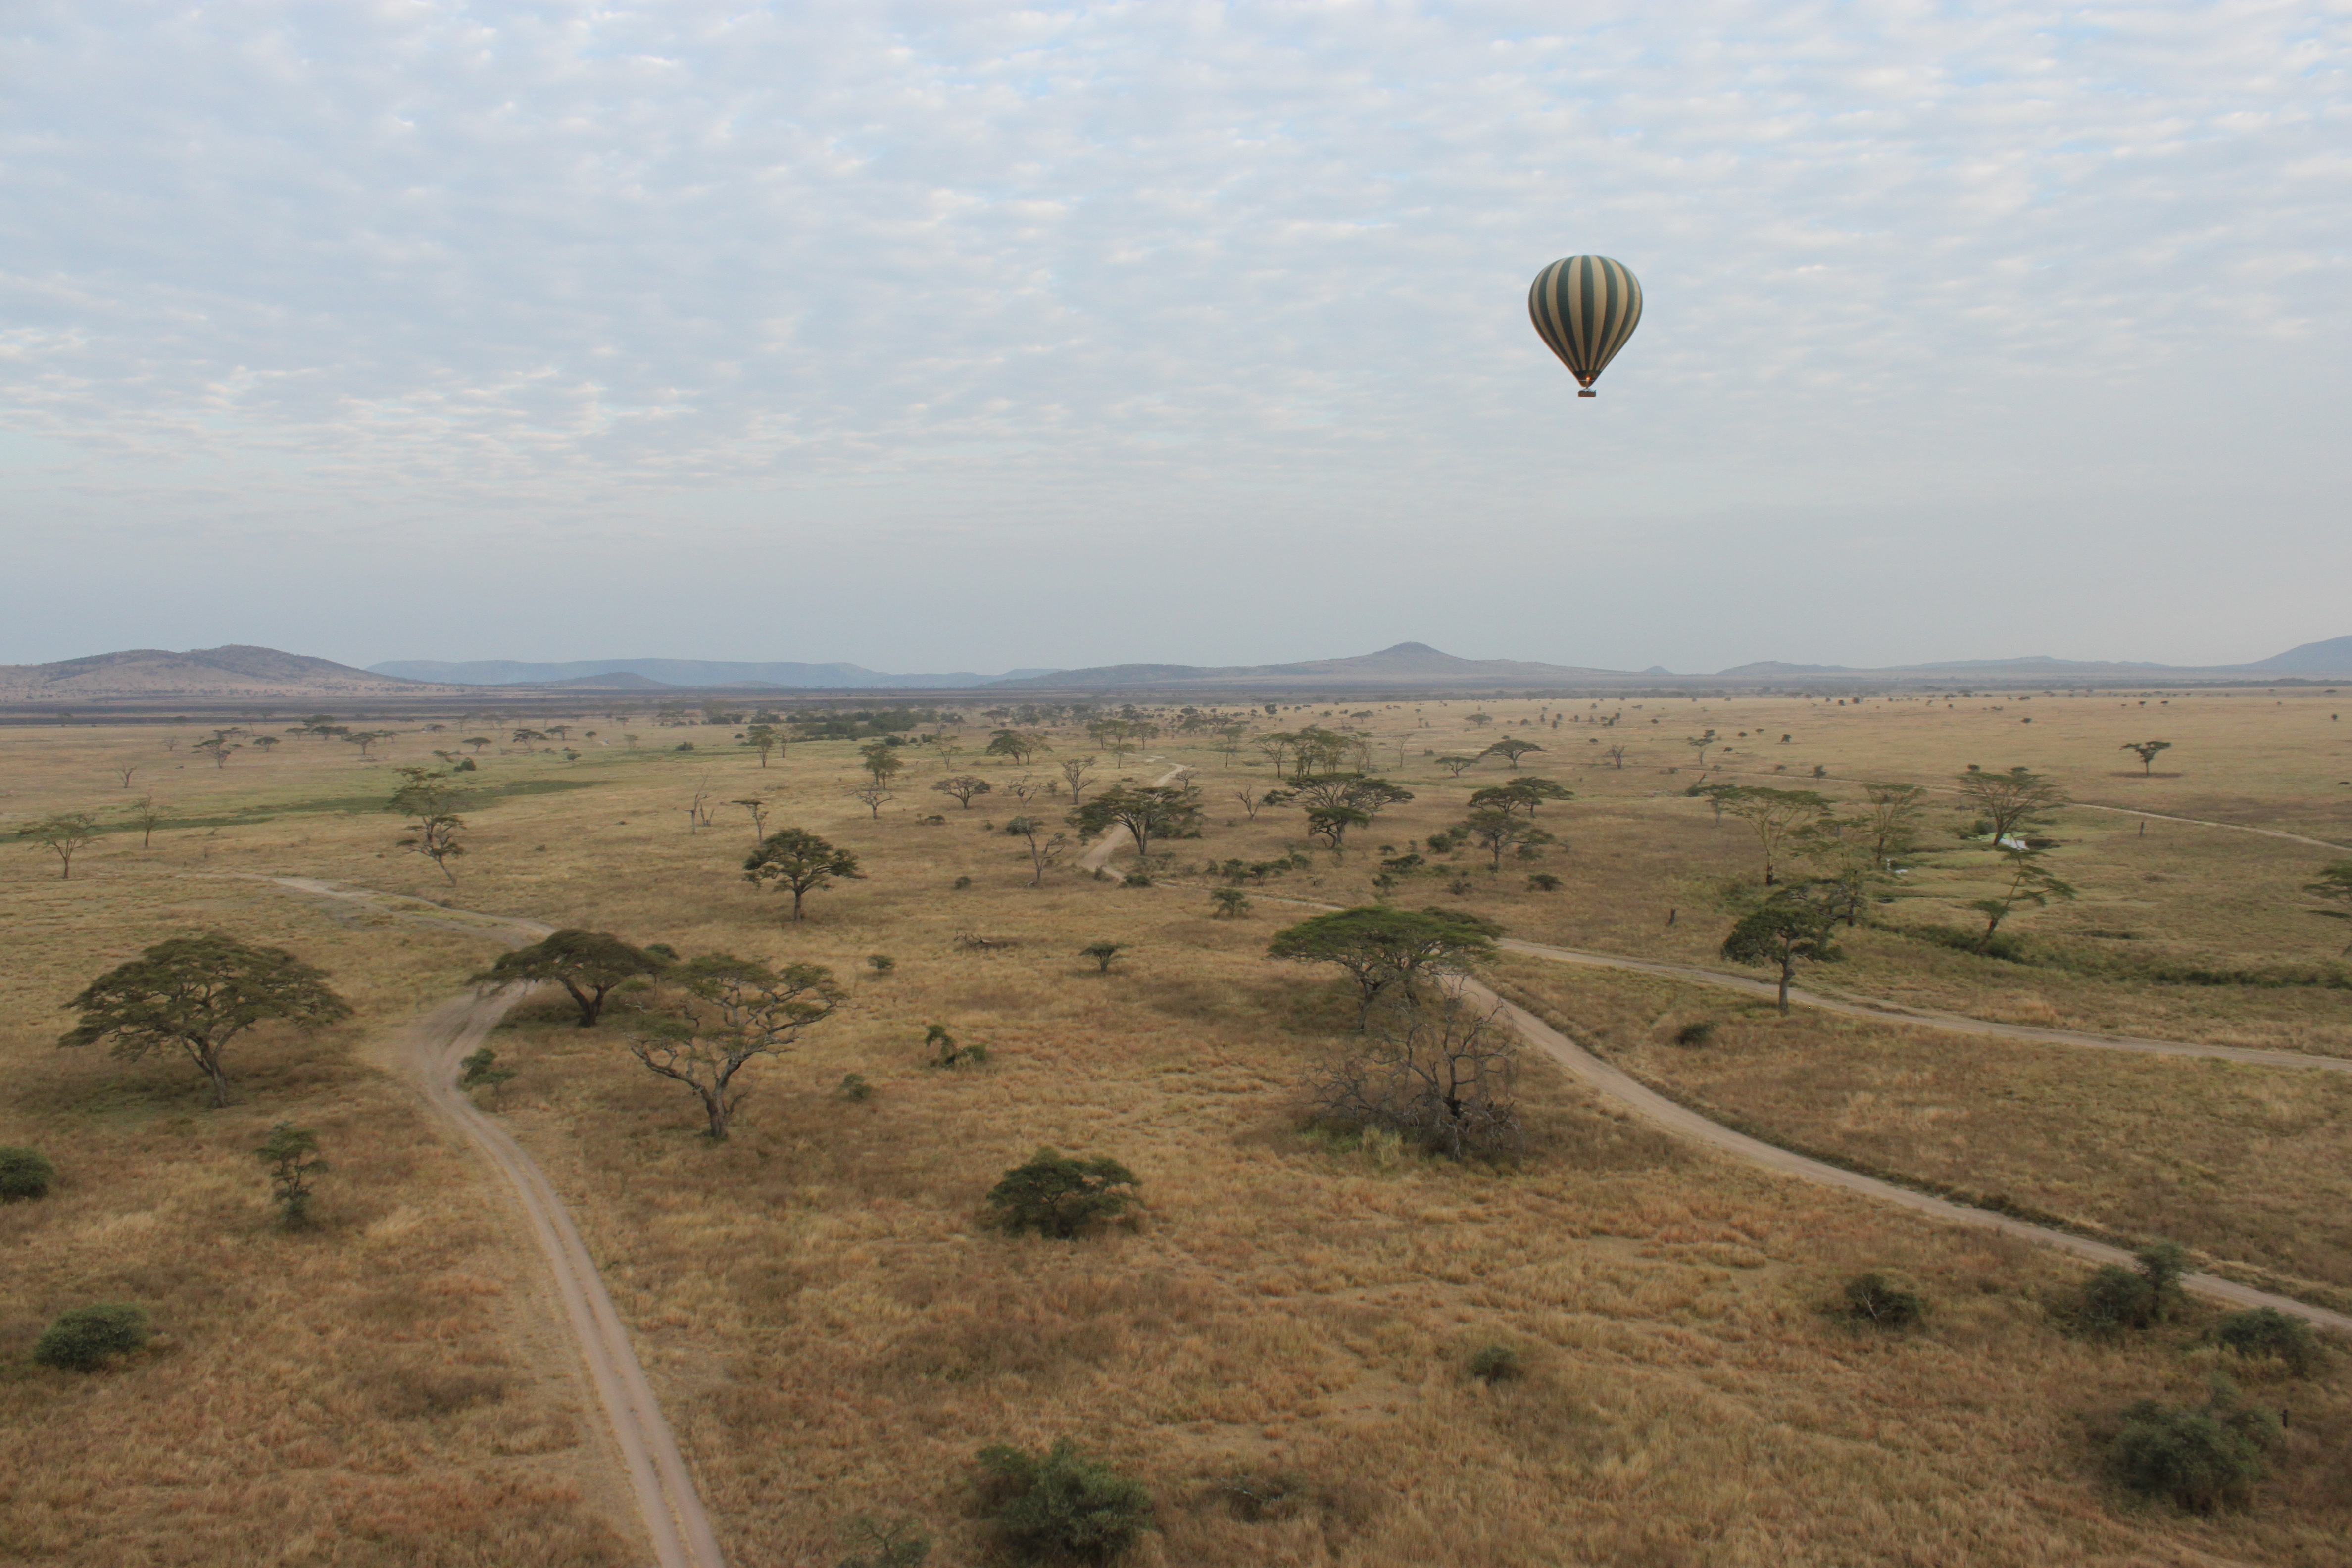
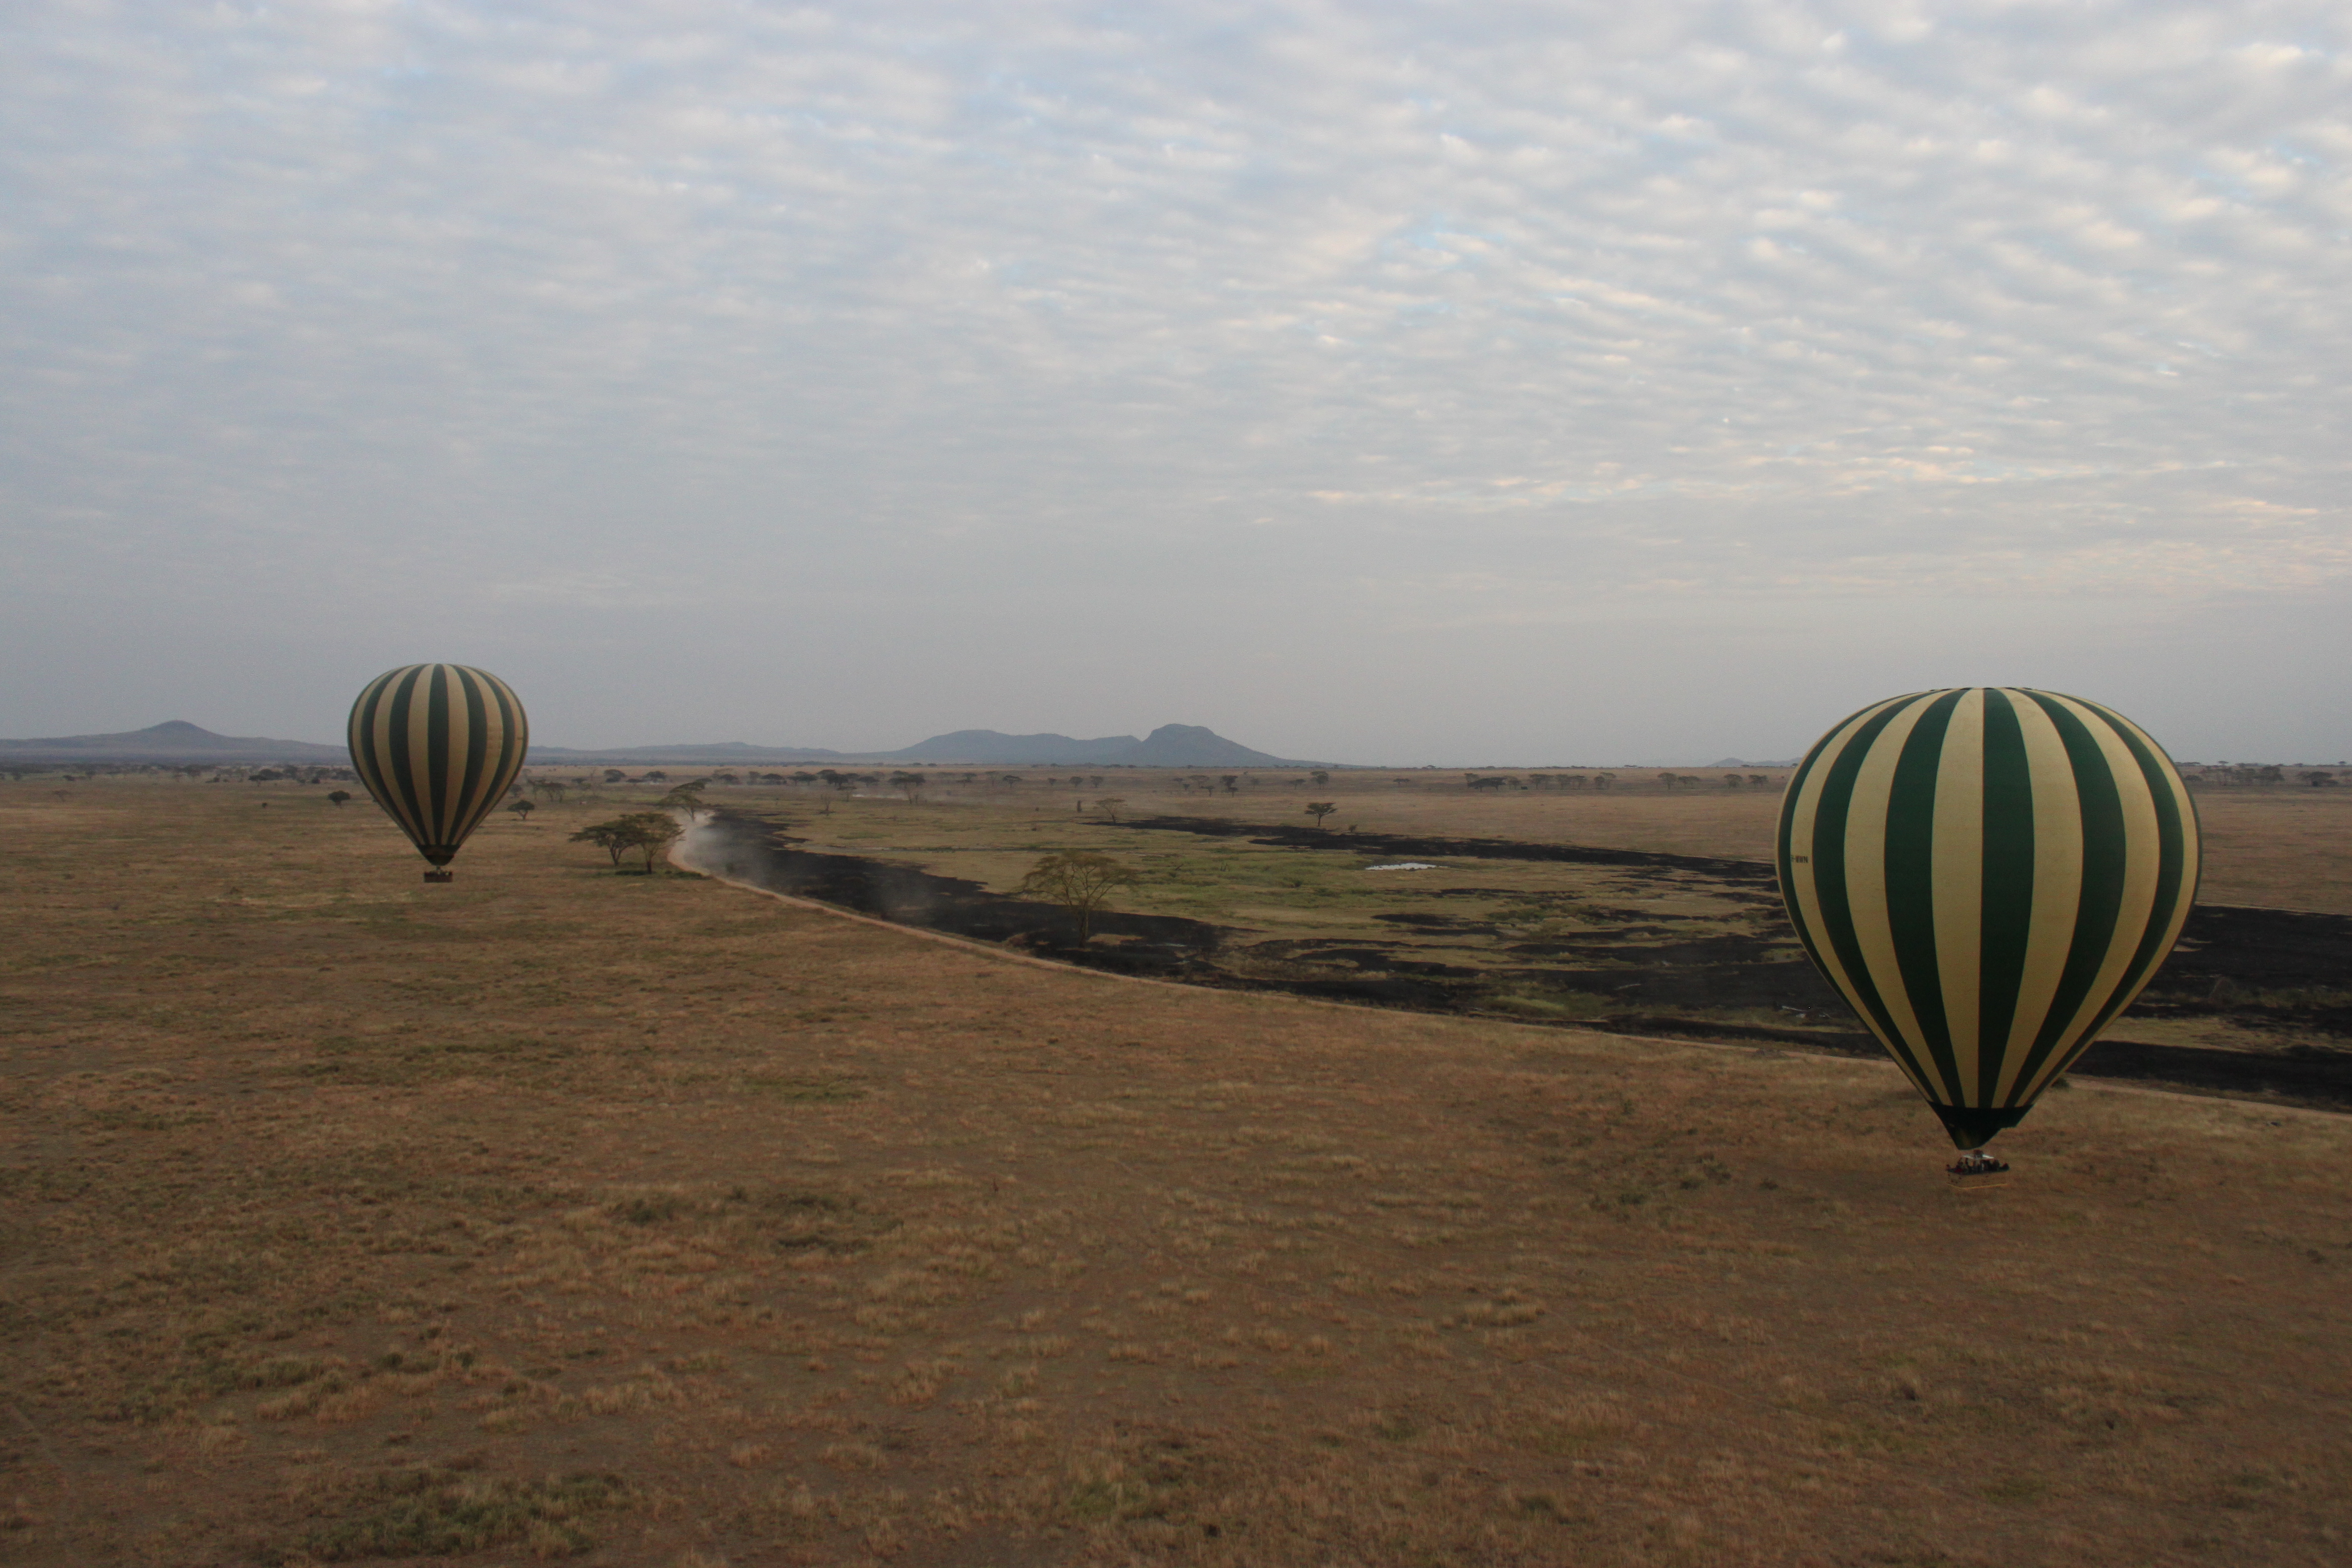
One of my favorite ways to see the Serengeti was from the unbeatable vantage point of a hot air balloon. Yes, that’s right. We might not have an indoor toilet or fresh food, but we have hot air balloons. Okay, that’s not entirely correct: Serengeti Balloon Safaris has hot air balloons that fly tourists over the heart of the park. In fact, you’ve probably seen them floating past in the camera trap photos:
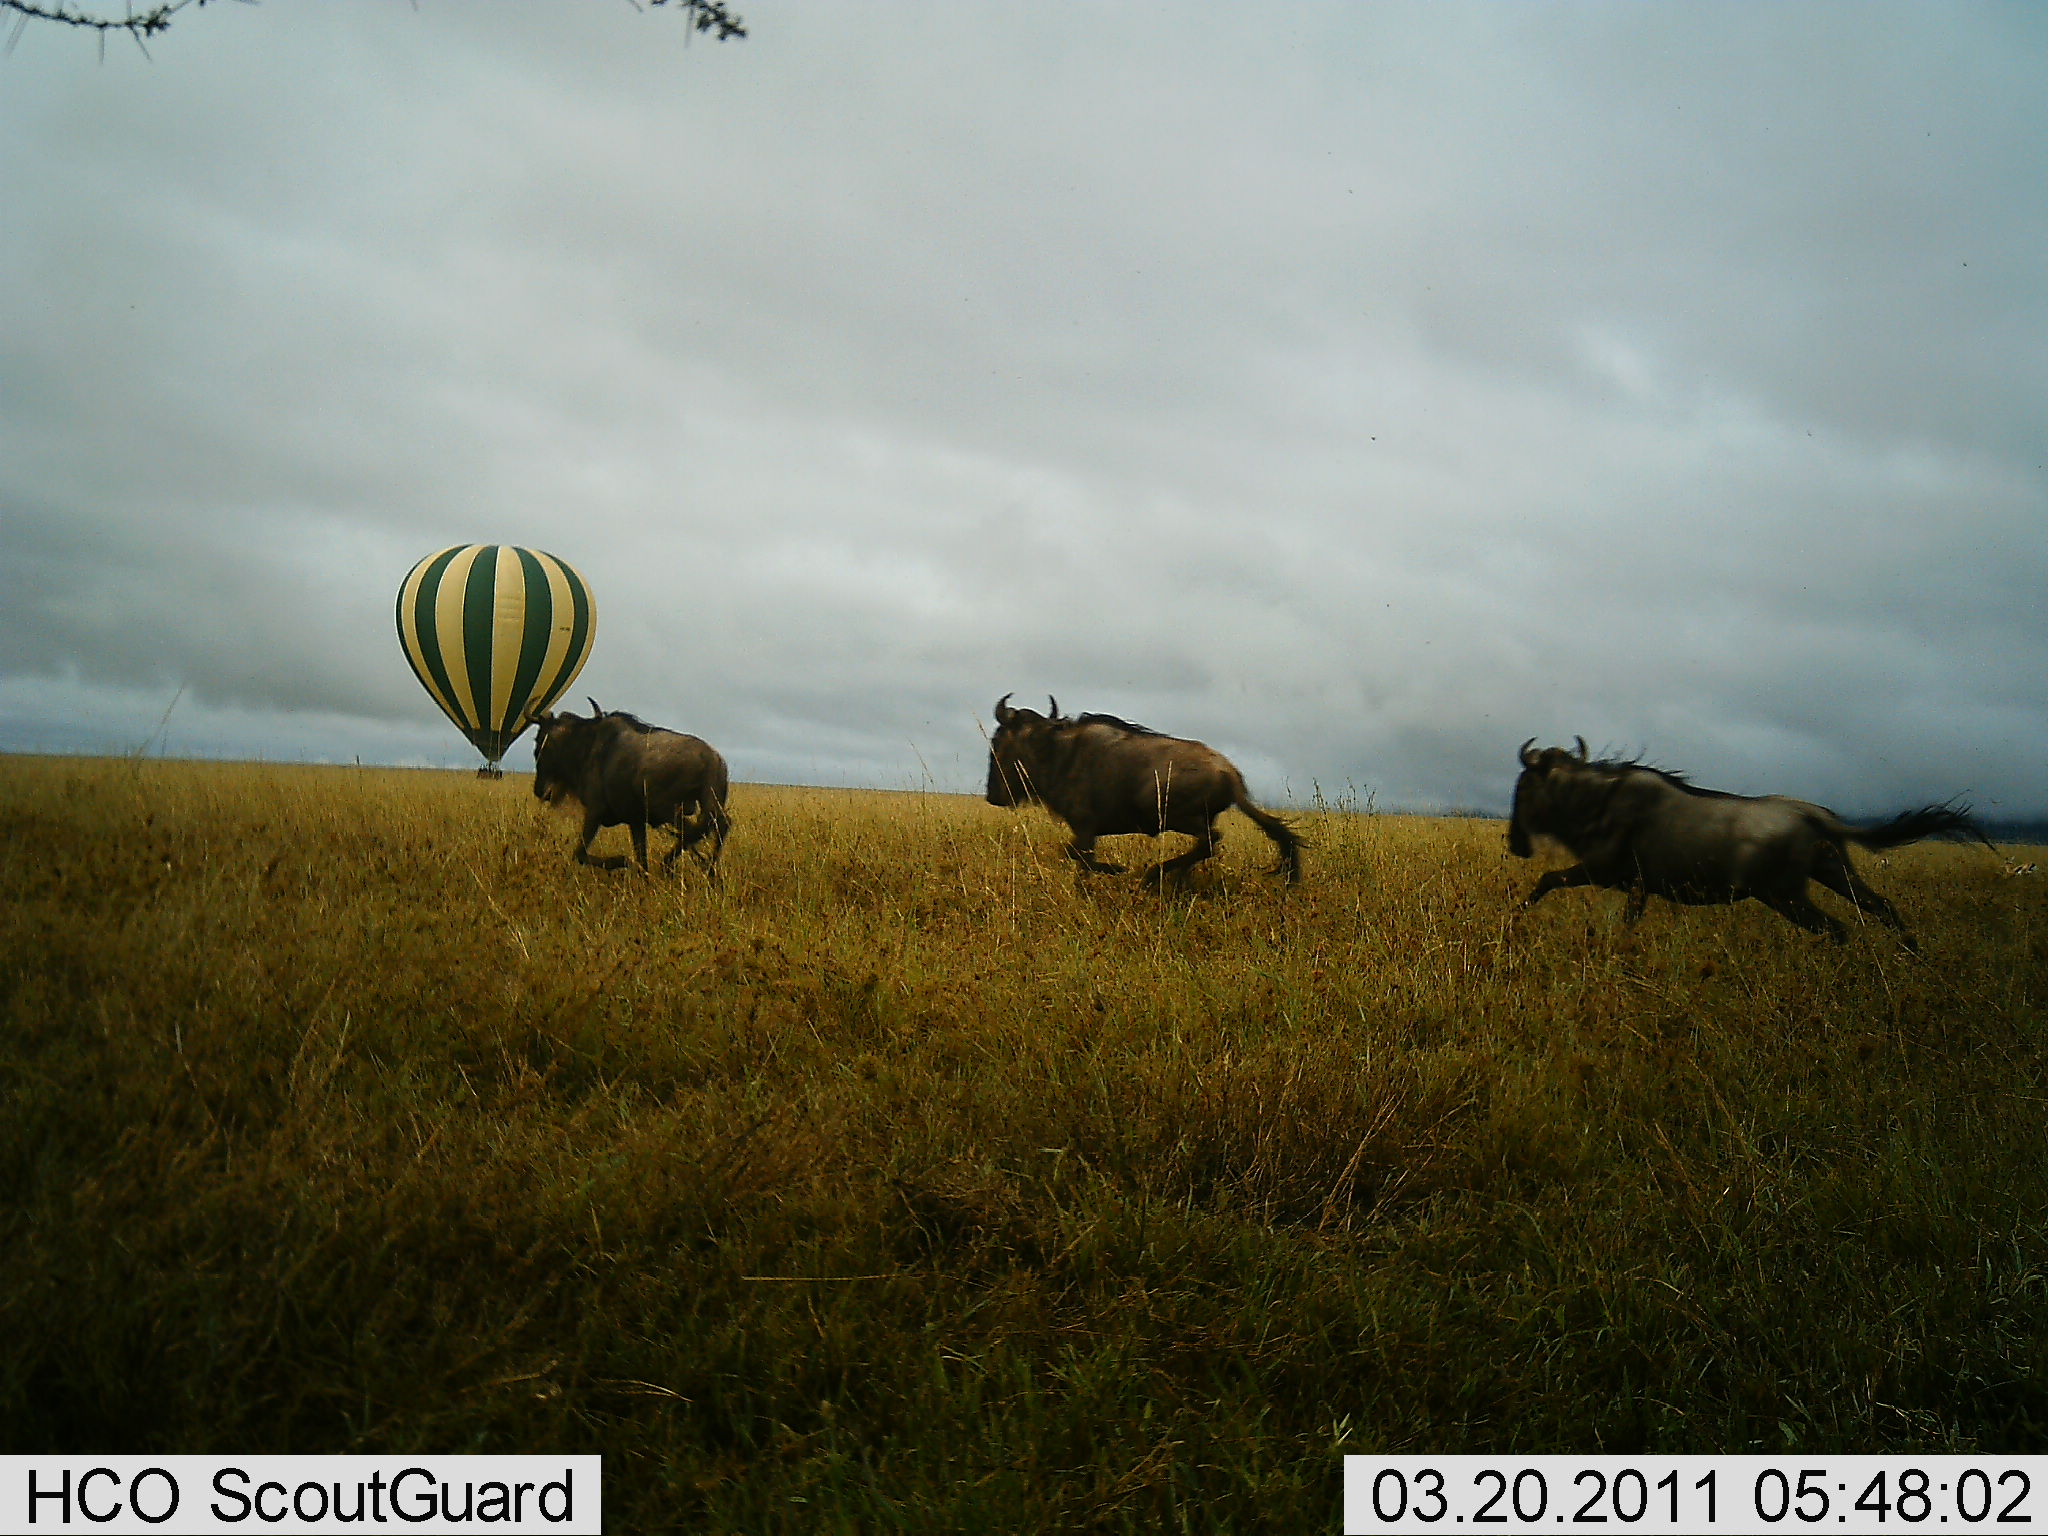
SBS has been flying balloons in Serengeti since the 1980’s, and has always helped us researchers out whenever they could, from letting us drag our hand-held tracking equipment up for flight to listen for lost lion prides, to letting us tinker with our Landrovers in their garage. In fact, they sponsored a lion cub during one of our fundraising campaigns a few years back – and now there’s a cub named “Balloo” living in the Mukoma Gypsies pride in the heart of Serengeti.
I went up for my first flight in 2010. George Lohay, Stan’s predecessor on the project, and I had to wake up at 4 am to make it to the launch field on time. That really is as terrible as it sounds, however, that morning it saved us from an invasion by the relentless carnivorous safari ants (siafu). Well, to be more exact, we were able to flee the house before the ants had invaded our beds, meaning we escaped with minimal damage. And by the time we returned that afternoon, the ants had already moved on.

I’ve been thinking about balloons lately because one of SBS’s pilots and a dear friend of the Serengeti Lion Project & Snapshot Serengeti, Jason Adams, is currently preparing to defend his title in Canada’s upcoming National Hot Air Ballooning Championships. Everyone in Serengeti and on the Snapshot team will be rooting for him. Good luck Jay!
Top speed: Technology, movement, and the cheetah’s secret weapon
I got to spend all of last week at a movement ecology workshop in Zurich, Switzerland – conveniently beating the heat wave Minnesota has apparently been having!

Migration patterns of the sooty shearwater, revealed by Scott Shaffer of UC Santa Cruz in a new study.
Movement ecology explores both how and why the way animals move the way they do, and what this means for them as individuals, as populations, and species. What triggers do animals use to decide where to go and what to do while they’re there? Why are some species territorial, while others overlap? Why are some species migratory? What do these behaviors mean for their individual fitness, their population dynamics, and global distributions? How does our understanding of animal movement change the way we try to protect species and the habitats they need?
It’s a pretty big field…and it’s one that is growing in leaps and bounds with modern technology – from camera traps to GPS collars, vast satellite networks and high resolution global imaging – we are able to ask questions about movement and distribution that would have been impossible just a few decades ago.
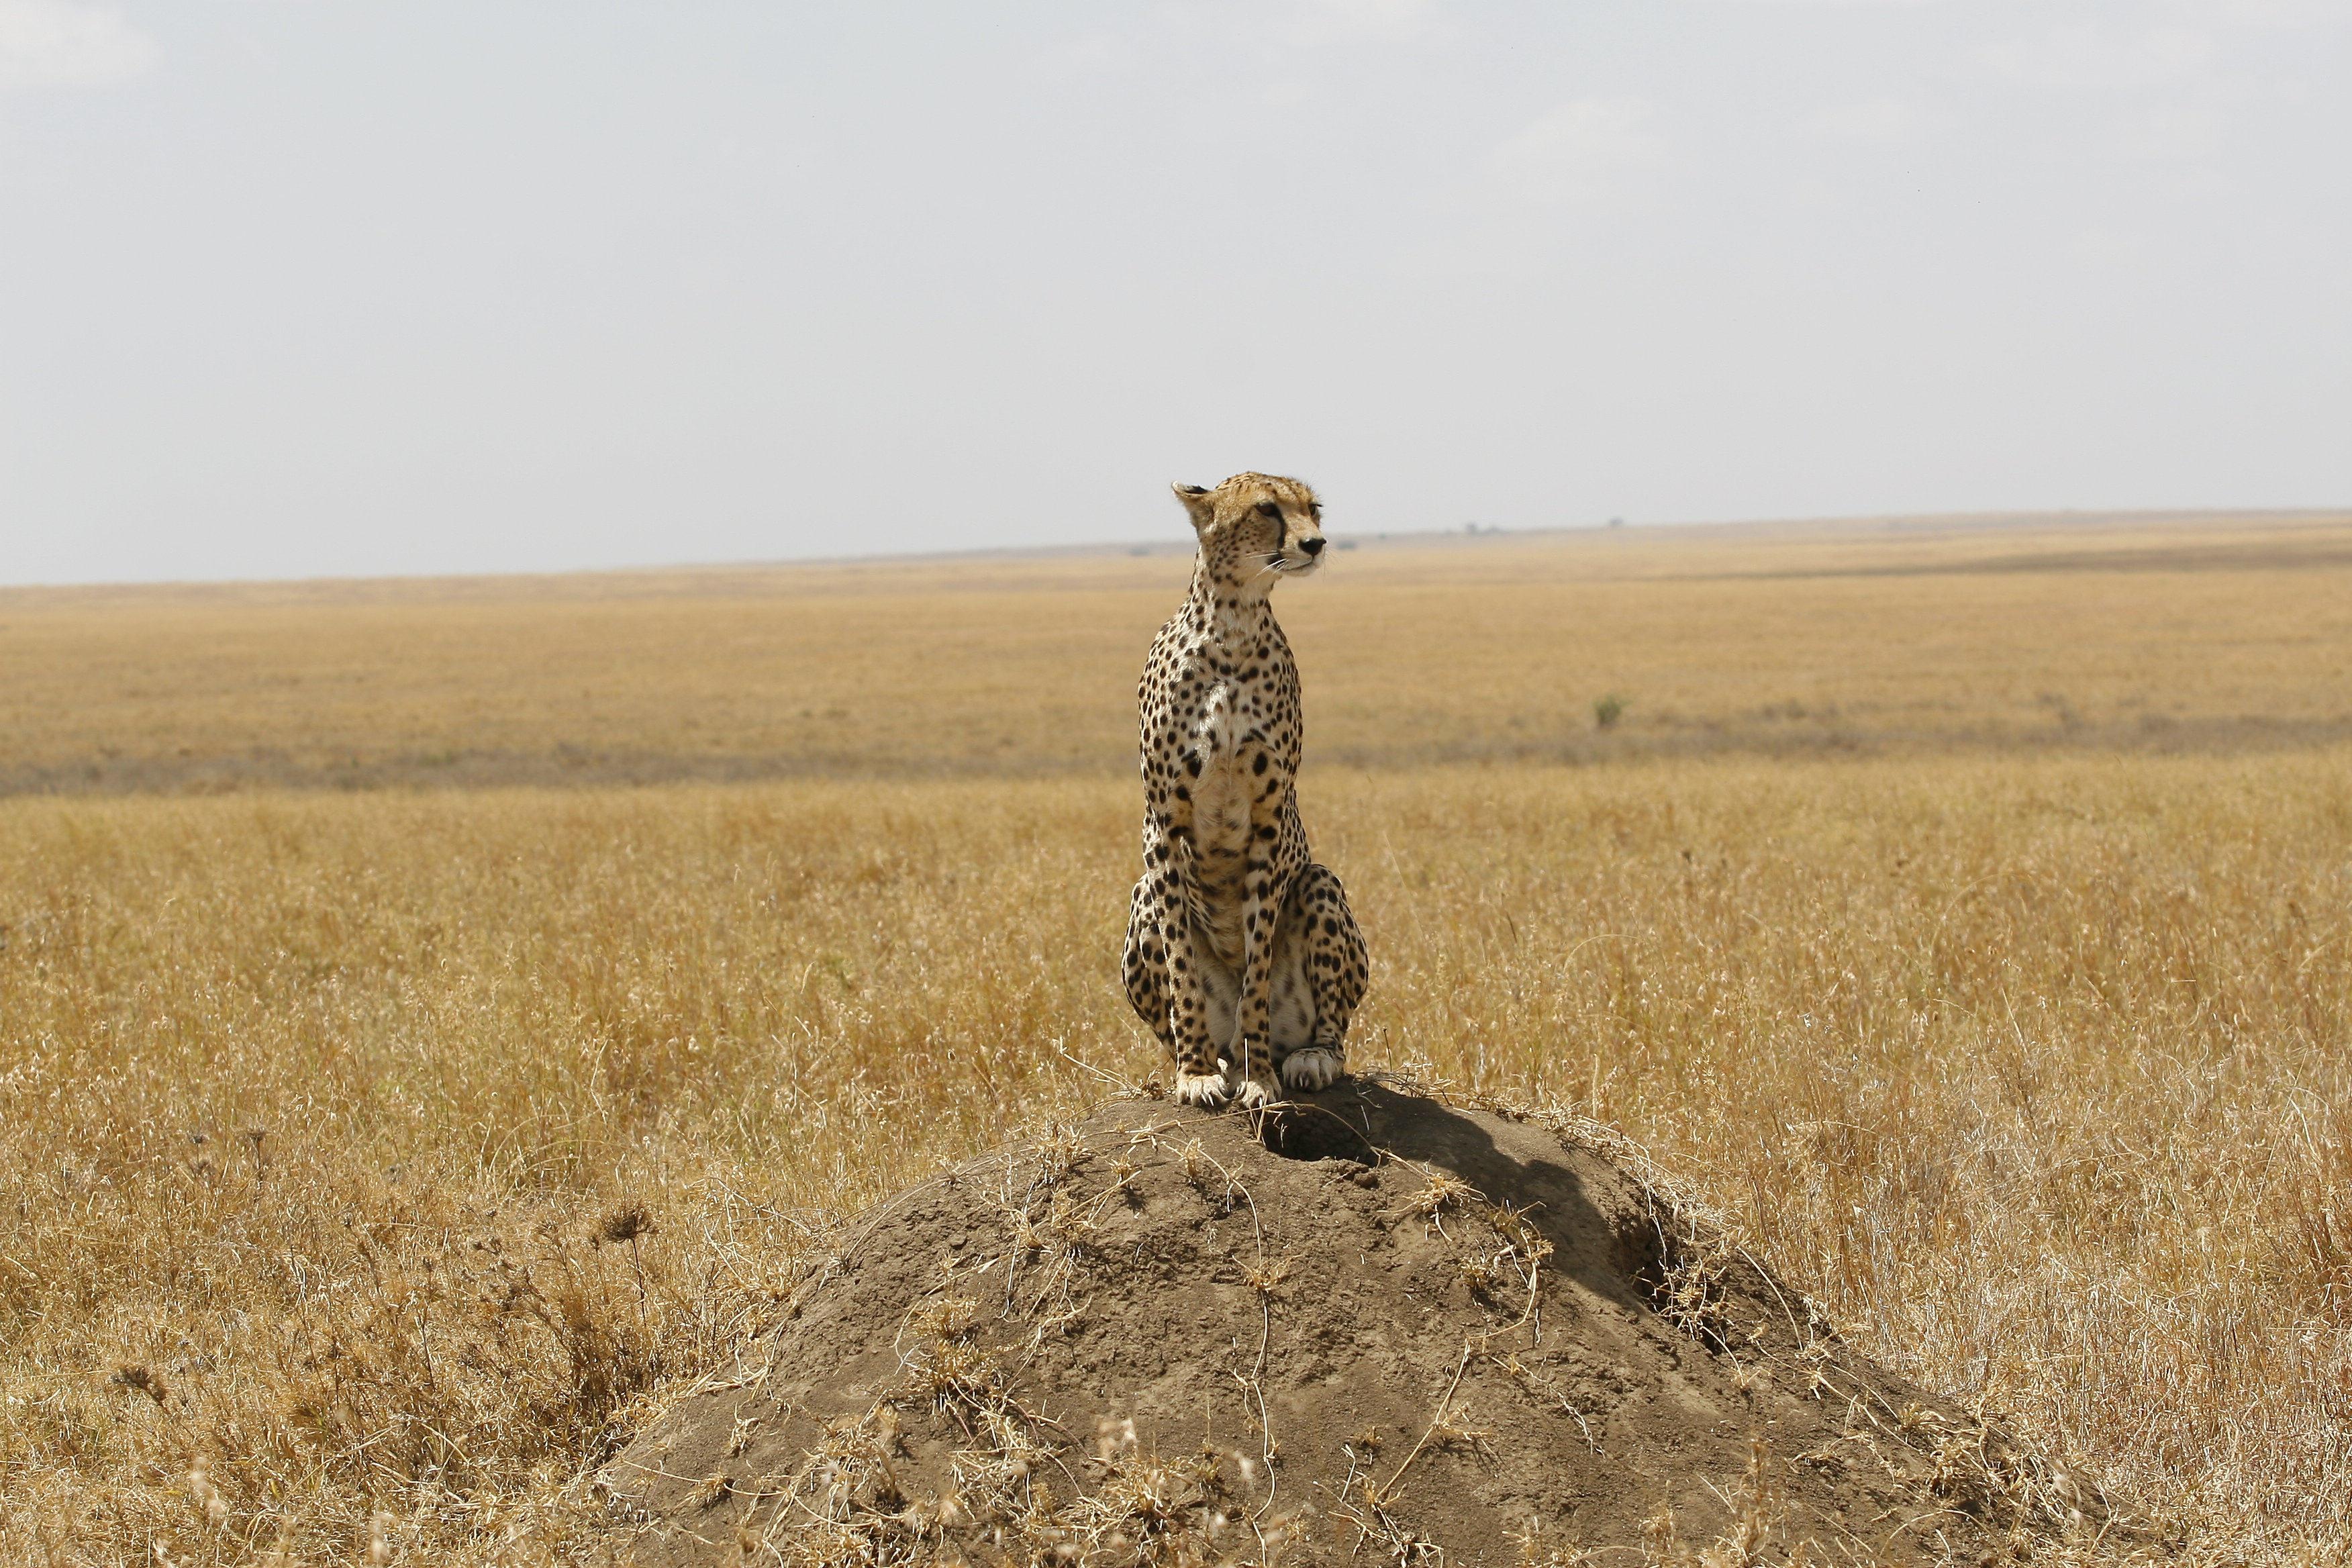
For example, researchers from London’s Royal Veterinary College recently discovered that cheetahs – contrary to popular opinion – might not rely on their top speed to catch their dinner, but instead their agility and acceleration. In captivity, cheetahs had been clocked at nearly 105 km/hour – but new, lightweight, super-fancy GPS collars let researchers take these speed tests to the wild. What they found was that cheetahs in the wild averaged about half that speed – but that they accelerated and turned with unparalleled power and agility. Which means that our long-standing perception of cheetahs as needing wide open spaces for really fast chases might not be accurate – and that they might actually be able to hunt quite well in the woods!
This is just one of many, many secrets that the field of movement ecology, with the help of modern GPS technology, is uncovering. Some other stories are a little less exotic and closer to home. The Today Show recently covered the amusing tale of a concerned cat owner who designed a tiny tracking device to see just where her pet was going every day. Her sleuthing turned up some interesting results – not just for cat owners, but for scientists too — and scientists are now encouraging cat owners around the country to track their cats and share their data on an online repository called Movebank.org. So if you have a cat and want to see where it goes when you’re not looking, or help scientists understand how domestic cats fit in to the larger ecosystem, check it out!
March of the Elephants
When you think of elephants, you may immediately think of their defining characteristics: trunks, big ears, tusks. Or you may think about how they live in large family groups and are very social. You may even think about the story of the blind men and the elephant. You probably don’t think about them as engineers of their ecosystem. But they are.
Elephants are native to the Serengeti ecosystem, but Serengeti elephants were likely all killed off for ivory in the 1800’s. At least, there weren’t any recorded there until the middle of the twentieth century when they started moving back in again. In the 1960’s they migrated in from both the north and the south, and by 1970 there were over 3,000 elephants in the Serengeti. Things got rocky for elephants again in the 1980’s as severe poaching reduced their numbers in Serengeti National Park to around 500. In 1988, elephants were given CITES endangered species status and worldwide trade in ivory was banned. This was good news for Serengeti elephants and their numbers rebounded again into the thousands.
These ups and downs in elephant population have allowed scientists to study the impact elephants have on their environment. I’ve written before about how the rainfall patterns in the Serengeti affect grasses, and about the role that fire plays. Elephants have their greatest impact on trees. Elephants eat both grasses and trees, but depend on trees for food during the dry season.
In the first half of the twentieth century, the number of trees per hectare was slowly declining across the Serengeti. But starting in the 1970’s, the number of trees rapidly increased. Scientists believe that the initial decrease in trees was due to the the disease rinderpest. Rinderpest killed off the majority of Serengeti’s wildebeest, allowing the grass to grow tall, and fueling huge, strong fires. These fires killed most tree seedlings, meaning that as trees died, they were not being replaced. When rinderpest was halted, the wildebeest population exploded, and the wildebeest kept the grass short and the fires smaller, allowing trees to gain a foothold once more.
Okay, but what about elephants? Well, elephants eat trees — especially small, tender saplings and regrowth from trees damaged by fire. In the 1980’s, while poaching was particularly severe on the Tanzanian side of Serengeti (Serengeti National Park), the Kenyan part of Serengeti (Maasai Mara) mounted a strong anti-poaching effort and kept its elephant numbers high. Across the Serengeti, the trees were increasing, but in the Maasai Mara there were also a lot of elephants. It turns out that in the Maasai Mara, the trees didn’t increase like they did across the border in Tanzania where the elephants had been greatly reduced. Instead the high number of elephants in the Maasai Mara is keeping tree numbers down, despite the reduction in fire intensity.
So elephants are key players in maintaining what scientists call “alternative stable states” in the Serengeti. While there are plenty of elephants once again in the Tanzanian part of the Serengeti, they don’t reduce the higher tree numbers; only fire can do that. But on the Kenyan side of the border, tree numbers remain low because elephants there have been continuously eating saplings; the tree population cannot increase because of the constant elephant pressure. The key difference between the two areas is simply their history.
I think the fourth blind man should get extra credit.
The Fourth reached out an eager hand,
And felt about the knee
“What most this wondrous beast is like
Is mighty plain,” quoth he:
“‘Tis clear enough the Elephant
Is very like a TREE!”

Analysis of ‘Save Snapshot Serengeti’
I did some analysis of what happened during our recent crowdfunding campaign that I want to share.
But first, I want to note a couple things that do not appear in the numbers. Several Snapshot Serengeti fans told us that they wanted to donate, but could not. This was because the Indiegogo site is set up to only accept major credit cards, and will not accept PayPal payments for campaigns (like ours) that send money to non-profits. As many folks outside the U.S. do not have credit cards, this was a barrier. We were unfortunately unable to figure out an alternative method of donation during the campaign, and as a result, a number of you couldn’t donate (or get the perks). And we’re sorry for that; lesson learned.
There were also several people who found our campaign after it had ended. They, too, couldn’t donate via the Indiegogo site. But we do have a webpage set up to accept any future gifts you might like to make. Donations go directly to the University of Minnesota Foundation; simply write “Snapshot Serengeti” in the text field after checking the “yes” box, and we’ll get the money.
And now for the numbers.
We raised $36,324 on Indiegogo, with 701 donors contributing. Of these 701, about a quarter (187) provided a mailing address for their perks. These 187 donors hail from 18 countries and 155 cities, most of them in the United States. We had donations from 27 U.S. states plus the District of Colombia. Here are some maps of where they are. Don’t forget that this is just a quarter of our generous donors! (And also, I just fell in love with MultiPlottr. It took me about a minute to make these maps.)

World map of (some) donor locations.

Close-up of the U.S. and Canada

Close-up of Europe
When we look over time, we see that some interesting things happened. This graph looks a bit busy, but hang in there while I explain it. (And many thanks to Rob Simpson, who helped put this graph together.) Click for a larger version.
 Along the bottom, we have the days of the campaign, starting on July 14 and running to August 9. The dots along the lines are daily dots. The green line shows the total dollar amount raised that day, and you can see the dollar values on the left side of the graph. The red line shows the total number of (unique) visitors to the Snapshot Serengeti site on that day. And I got Indiegogo to send me the data on visitors to the Indiegogo webpage; that’s the yellow line. You can see the values for the red and yellow lines on the right side of the graph.
So what do we see? Here are some things I’ve noticed; maybe you can point out some others. Our initial donations came from our hardcore supporters in the first few days – those of you who read this blog or have liked us on Facebook. The National Geographic article that came out the same day was cool, but didn’t have any links to our campaign for several days.
On July 26, we sent out a newsletter to everyone who’s ever worked on Snapshot Serengeti, announcing Season 6 and our crowdfunding campaign. You can see an immediate uptick in donations (green line) that remains elevated for the next few days. Traffic to Snapshot Serengeti (red line) also increases, but not by a lot. On July 29, we got some coverage at KSTP, our favorite local Minnesota TV station, which may have contributed a little.
But the big event was the following day, when the Zooniverse sent out a newsletter to all of its users. You can see the impact. Lots of folks rushed over to check out Snapshot Serengeti (red line), some of them also checked out the Indiegogo page (yellow line) and 107 of them contributed $4,700 (green line).
All that activity, helped secure us a spot on Indiegogo’s front page on August 1. You can see that for the next few days, visits to our Indiegogo site (yellow line) – and funding (green line) – increased, while attention over at Snapshot Serengeti itself waned. This suggests that being on Indiegogo’s front page was useful and helped keep donations flowing.
On August 4, National Geographic gave us some more great coverage, this time with appropriate links to our campaign. And on August 5, a piece I wrote about the campaign was published on a blog that is frequented by scientists interested in crowdfunding. Both things appeared to give us a boost.
On August 6, we marked down the damaged camera traps, and had a bunch of takers. We also had coverage on BoingBoing the same day, but they initially linked to our About page, so I’m not sure how much impact that had on our fundraising.
It was August 8, our second-to-last day, that sealed the deal. We made Indiegogo’s top “Last Chance” projects. And the Zooniverse sent out another newsletter asking for help getting us the last part of the way to our goal. And the Zoonites (Zoonorians? Zooners?) responded. That day, 219 people gave almost $10,000!
Thanks again to everyone who contributed and also to those who tried but weren’t able.
Lions, cheetahs, and dogs, oh my! (Continued)
Last month, I wrote about how, despite lions killing cheetah cubs left and right, they don’t seem to be suppressing cheetah population size like they do for wild dogs. And, that despite all this killing, that cheetahs don’t seem to be avoiding lions – but I didn’t have radio-collar data for wild dogs.
Well, now I do!
Although we’ve had collared lions continuously since 1984, Serengeti cheetahs and wild dogs were only collared from 1985-1990. We worked with Tim Caro, former director of the cheetah project, to access the historic cheetah data a year ago, but it was only a month ago that we finally tracked down the historic wild dog data. Thanks to a tip by a former Frankfurt Zoological Society employee, we found the data tucked away in the recesses of one of their Serengeti-based storage containers – and Craig braved a swarm of very angry bees to retrieve it!
The good news is that the data was totally worth it. Just like we suspected, even though cheetahs didn’t seem to be avoiding lions, wild dogs were. This map shows lion densities in the background, with cheetah (in brown dots) and wild dog (black triangles) locations overlaid on the lion densities.
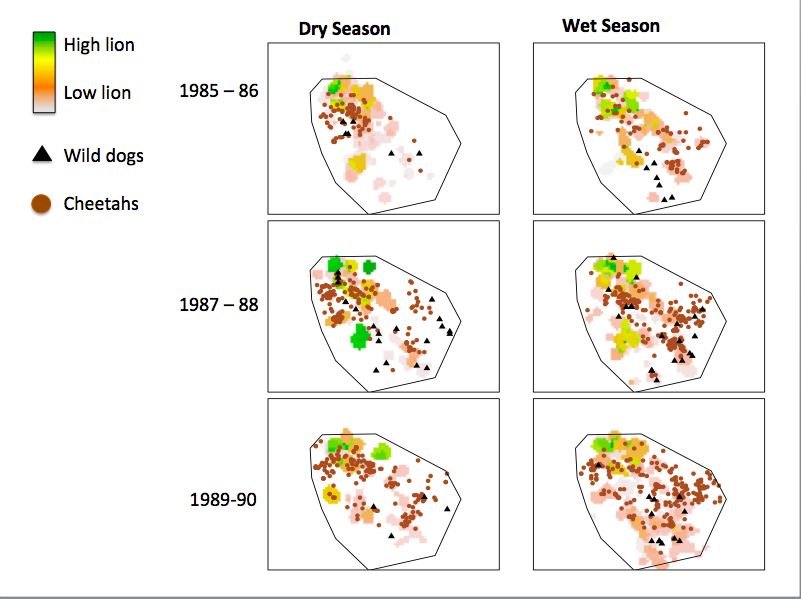
Lions, cheetahs, and wild dogs from when all three species were radio-collared in Serengeti.
It’s a pretty cool contrast. Even though lions kill cheetah cubs left and right, cheetahs do not avoid lions, nor do their populations decline as lions increase. In sharp contrast, wild dogs do avoid lions, and their populations also drop as lions increase. Now, that’s not to say that there weren’t other factors influencing the decline of wild dogs in Serengeti, but across Africa, this pattern seems to hold.
Speaking of wild dogs, has any one seen any in Season 6?
