
Algorithm vs. Experts
Recently, I’ve been analyzing how good our simple algorithm is for turning volunteer classifications into authoritative species identifications. I’ve written about this algorithm before. Basically, it counts up how many “votes” each species got for every capture event (set of images). Then, species that get more than 50% of the votes are considered the “right” species.
To test how well this algorithm fares against expert classifiers (i.e. people who we know to be very good at correctly identifying animals), I asked a handful of volunteers to classify several thousand randomly selected captures from Season 4. I stopped everyone as soon as I knew 4,000 captures had been looked at, and we ended up with 4,149 captures. I asked the experts to note any captures that they thought were particularly tricky, and I sent these on to Ali for a final classification.
Then I ran the simple algorithm on those same 4,149 captures and compared the experts’ species identifications with the algorithm’s identifications. Here’s what I found:
 For a whopping 95.8% of the captures, the simple algorithm (due to the great classifying of all the volunteers!) agrees with the experts. But, I wondered, what’s going on with that other 4.2%. So I had a look:
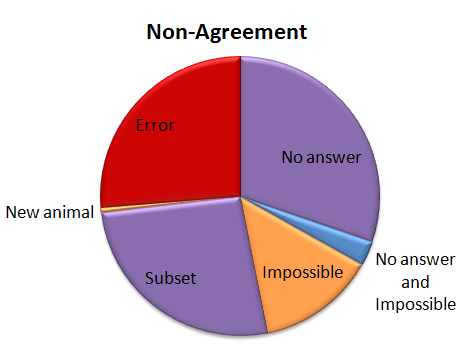 Of the captures that didn’t agree, about 30% were due to the algorithm coming up with no answer, but the experts did. This is “No answer” in the pie chart. The algorithm fails to come up with an answer when the classifications vary so much that there is no single species (or combination if there are multiple species in a capture) that takes more than 50% of the vote. These are probably rather difficult images, though I haven’t looked at them yet.
Another small group — about 15% of captures was marked as “impossible” by the experts. (This was just 24 captures out of the 4,149.) And five captures were both marked as “impossible” and the algorithm failed to come up with an answer; so in some strange way, we might consider these five captures to be in agreement.
Just over a quarter of the captures didn’t agree because either the experts or the algorithm saw an extra species in a capture. This is labeled as “Subset” in the pie chart. Most of the extra animals were Other Birds or zebras in primarily wildebeest captures or wildebeest in primarily zebra captures. The extra species really is there, it was just missed by the other party. For most of these, it’s the experts who see the extra species.
Then we have our awesome, but difficulty-causing duiker. There was no way for the algorithm to match the experts because we didn’t have “duiker” on the list of animals that volunteers could choose from. I’ve labeled this duiker as “New animal” on the pie chart.
Then the rest of the captures — just over a quarter of them — were what I’d call real errors. Grant’s gazelles mistaken for Tommies. Buffalo mistaken for wildebeest. Aardwolves mistaken for striped hyenas. That sort of thing. They account for just 1.1% of all the 4,149 captures.
I’ve given the above Non-agreement pie chart some hideous colors. The regions in purple are what scientists call Type II errors, or “false negatives.” That is, the algorithm is failing to identify a species that we know is there — either because it comes up with no answer, or because it misses extra species in a capture. I’m not too terribly worried about these Type II errors. The “Subset” ones happen mainly with very common animals (like zebra or wildebeest) or animals that we’re not directly studying (like Other Birds), so they won’t affect our analyses. The “No answers” may mean we miss some rare species, but if we’re analyzing common species, it won’t be a problem to be missing a small fraction of them.
The regions in orange are a little more concerning; these are the Type I errors, or “false positives.” These are images that should be discarded from analysis because there is no useful information in them for the research we want to do. But our algorithm identifies a species in the images anyway. These may be some of the hardest captures to deal with as we work on our algorithm.
And the red-colored errors are obviously a concern, too. The next step is to incorporate some smarts into our simple algorithm. Information about camera location, time of day, and identification of species in captures immediately before or following a capture can give us additional information to try to get that 4.2% non-agreement even smaller.
10 responses to “Algorithm vs. Experts”
Trackbacks / Pingbacks
- - June 7, 2013
- - June 10, 2013
- - September 11, 2013
- - October 9, 2013
- - October 16, 2013
- - May 20, 2014
- - March 11, 2015

Regarding the non-agreement questions that did not reach a 50% majority: how many of those photographs would the algorithm have correctly identified with a strict majority rule ID? (i.e. how many photographs would be correctly identified if the algorithm just searched for the most common answer?)
That’s a good question. I haven’t tried that yet, but I’ll let you know when I do.
Thanks much!