
Handling difficult images
From last week’s post, we know that we can identify images that are particularly difficult using information about classification evenness and the fraction of “nothing here” votes cast. However, the algorithm (and really, all of you volunteers) get the right answer even on hard images most of the time. So we don’t necessary want to just throw out those difficult images. But can we?
Let’s think about two classes of species: (1) the common herbivores and (2) carnivores. We want to understand the relationship between the migratory and non-migratory herbivores. And Ali is researching carnivore coexistence. So these are important classes to get right.
First the herbivores. Here’s a table showing the most common herbivores and our algorithm’s results based on the expert-classified data of about 4,000 images. “Total” is the total number of images that our algorithm classified as that species, and “correct” is the number of those that our experts agreed with.
| species | migratory | total | correct | % correct |
| wildebeest | yes | 1548 | 1519 | 98.1% |
| zebra | yes | 685 | 684 | 100% |
| hartebeest | no | 252 | 244 | 96.8% |
| buffalo | no | 219 | 215 | 98.2% |
| gazelleThomsons | yes | 200 | 189 | 94.5% |
| impala | no | 171 | 168 | 98.3% |
We see that we do quite well on the common herbivores. Perhaps we’d wish for Thomsons gazelles to be a bit higher (Grants gazelles are most commonly mis-classified as Thomsons), but these results look pretty good.
If we wanted to be conservative about our estimates of species ranges, we could throw out some of the images with high Pielou scores. Let’s say we threw out the 10% most questionable wildebeest images. Here’s how we would score. (Note that I didn’t do the zebra, since they’d be at 100% again, no matter how many we dropped.) The columns are the same as the above table, except this time, I’ve listed the threshold Pielou score used to throw out 10% of the images of that species.
| species | Pielou cutoff | total | correct | % correct |
| wildebeest | 0.60 | 1401 | 1389 | 99.1% |
| hartebeest | 0.73 | 228 | 223 | 97.8% |
| buffalo | 0.76 | 198 | 198 | 100% |
| gazelleThomsons | 0.72 | 180 | 175 | 97.2% |
| impala | 0.86 | 155 | 153 | 98.7% |
We do quite a bit better with our Thomsons gazelle and increase the accuracy of all the other species at least a little. But do we sacrifice anything throwing out data like that? If wildebeest make up a third of our images and we have a million images, then we’re throwing away 33,000 images(!), but we still have another 300,000 left to do our analyses. One thing we will look at in the future is how much dropping the most questionable images affects estimates of species ranges. I’m guessing that for wildebeest it won’t be much.
What if we did the same thing for Thomsons gazelle or impala? We would expect about 50,000 images of each of those per million images. Throwing out 5,000 images still leaves us with 45,000, which seems like it might be enough for many analyses.
Now let’s look at the carnivore classifications from the expert-validated data set:
| species | total | correct | % correct |
| hyenaSpotted | 55 | 55 | 100% |
| lionFemale | 18 | 18 | 100% |
| cheetah | 6 | 6 | 100% |
| serval | 6 | 6 | 100% |
| leopard | 3 | 3 | 100% |
| jackal | 2 | 2 | 100% |
| lionMale | 1 | 1 | 100% |
| aardwolf | 1 | 1 | 100% |
| batEaredFox | 1 | 0 | 0% |
| hyenaStriped | 1 | 0 | 0% |
Wow! You guys sure know your carnivores. The two wrong answers were the supposed bat-eared fox that was really a jackal and the supposed striped hyena that was really an aardwolf. These two wrong answers had high Pielou scores: 0.77 and 0.83 respectively.
Judging by this data set, about 2.5% of all images are carnivores, which gives us about 25,000 carnivore images for every million we collect. That’s a lot of great data on these relatively rare animals! But it’s not so much that we want to throw any of it away. Fortunately, we won’t have to. We can use the Pielou score to have an expert look at the most difficult images.
Let’s say Ali wants to be very confident of her data. She can choose the 20% most difficult carnivore images — which is only about 5,000 per million images, and she can go through them herself. Five thousand images is nothing to sneeze at, of course, but the work can be done in a single day of intense effort.
In summary, we might be able to throw out some of the more difficult images (based on Pielou score) for the common herbivores without losing much coverage in our data. Further analyses are needed, though, to see if doing so is worthwhile and whether we lose anything by throwing out so many correct answers. For carnivores, the difficult images can be narrowed down sufficiently that an expert can double-check them by hand.
4 responses to “Handling difficult images”
Trackbacks / Pingbacks
- - March 11, 2015

That’s very comforting when you are agonising over classifying a really difficult image. Its good to know that what we all do really does help.
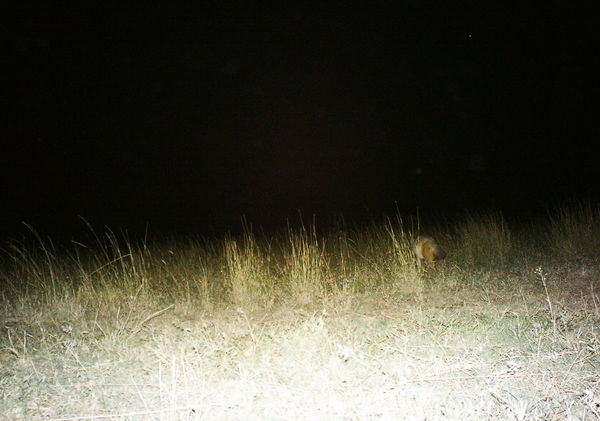
So what IS the creature in the night photo at the top? I can’t even decide if that’s its head or butt because either way it doesn’t look like any animal I can think of!
That’s the jackal that the algorithm classified as a bat-eared fox. Votes were batEaredFox-14, “nothing here”-10, jackal-6, aardwolf-4, dikDik-2, hyenaSpotted-1, and wildcat-1.