
On fencing wildlife reserves
Craig wrote an op-ed in the Los Angeles Times today. He argues that fencing wildlife reserves in Africa is a cost-effective and necessary step to conserving Africa’s big mammals. The reasons that reserves need fencing now have to do with demographic changes over the half-century since they were established. He points out that fences won’t work for some reserves, especially those that depend on wildlife migration over reserve boundaries, but that for many, it may be an important step towards conservation sustainability. (For what it’s worth, those reserves like Tarangire with in-out migration may be doomed anyway, as human population and agriculture increase around the reserve and effectively block the migration anyway.)
Craig’s opinion piece derives from a study he and many others did comparing the success of Africa’s reserves based on various attributes of those reserves *. The effectiveness of conservation efforts is not usually measured; mostly, people would rather their money to go conservation actions rather than conservation monitoring programs. Lacking specific monitoring data, the approach of Craig’s study is one way to look at what works and what doesn’t when it comes to conservation. And the data say that fences work in (most) African wildlife reserves.
Your gut reaction to fencing wildlife areas might be aversion, or even horror. I know I wince when I consider the idea. Fences are unattractive. But they’re especially unattractive, I want to point out, for those of us with the luxury of living far from major human-wildlife conflict. If there were reasonable chances that a lion or leopard might carry off my child – or kill my livestock – or that elephants would trample my carefully tended crops – I would welcome a fence. North Americans and Europeans have historically come into conflict with wild animals when human needs for land, food, and fuel have increased. They have largely solved this human-wildlife conflict by eliminating the wildlife. Africans have done a better job of retaining their wildlife, but their needs for land, food, and fuel are also increasing. As unaesthetic as they might seem, maybe fences around wildlife reserves can help both Africa’s wildlife and its people.

* “Conserving large carnivores: dollars and fence” in Ecology Letters, 2013 Volume 16, pages 635-641. DOI: 10.1111/ele.12091
Authors: C. Packer A. Loveridge S. Canney T. Caro S.T. Garnett M. Pfeifer K.K. Zander A. Swanson D. MacNulty G. Balme H. Bauer C.M. Begg K.S. Begg S. Bhalla C. Bissett T. Bodasing H. Brink A. Burger A.C. Burton B. Clegg S. Dell A. Delsink T. Dickerson S.M. Dloniak D. Druce L. Frank P. Funston N. Gichohi R. Groom C. Hanekom B. Heath L. Hunter H.H. DeIongh C.J. Joubert S.M. Kasiki B. Kissui W. Knocker B. Leathem P.A. Lindsey S.D. Maclennan J.W. McNutt S.M. Miller S. Naylor P. Nel C. Ng’weno K. Nicholls J.O. Ogutu E. Okot‐Omoya B.D. Patterson A. Plumptre J. Salerno K. Skinner R. Slotow E.A. Sogbohossou K.J. Stratford C. Winterbach H. Winterbach S. Polasky.
Gail, Garth or Gerta? Cataloguing the giraffes of the Serengeti
Today’s guest post is written by Megan Strauss, a researcher at the University of Minnesota. She runs the Serengeti Giraffe Project.
If you had visited the lion research house between 2008 and 2010, in addition to Fabio, the stuffed lion, the mantelpiece full of animal skulls, and the aquarium of incredibly hardy fish, you would have seen this photo of a male giraffe, which I taped to one of the bedroom doors:
For the last few years, I’ve tracked these quiet giants of the Serengeti woodlands, studying their population dynamics, the vegetation they eat, and their interactions with lions and people.
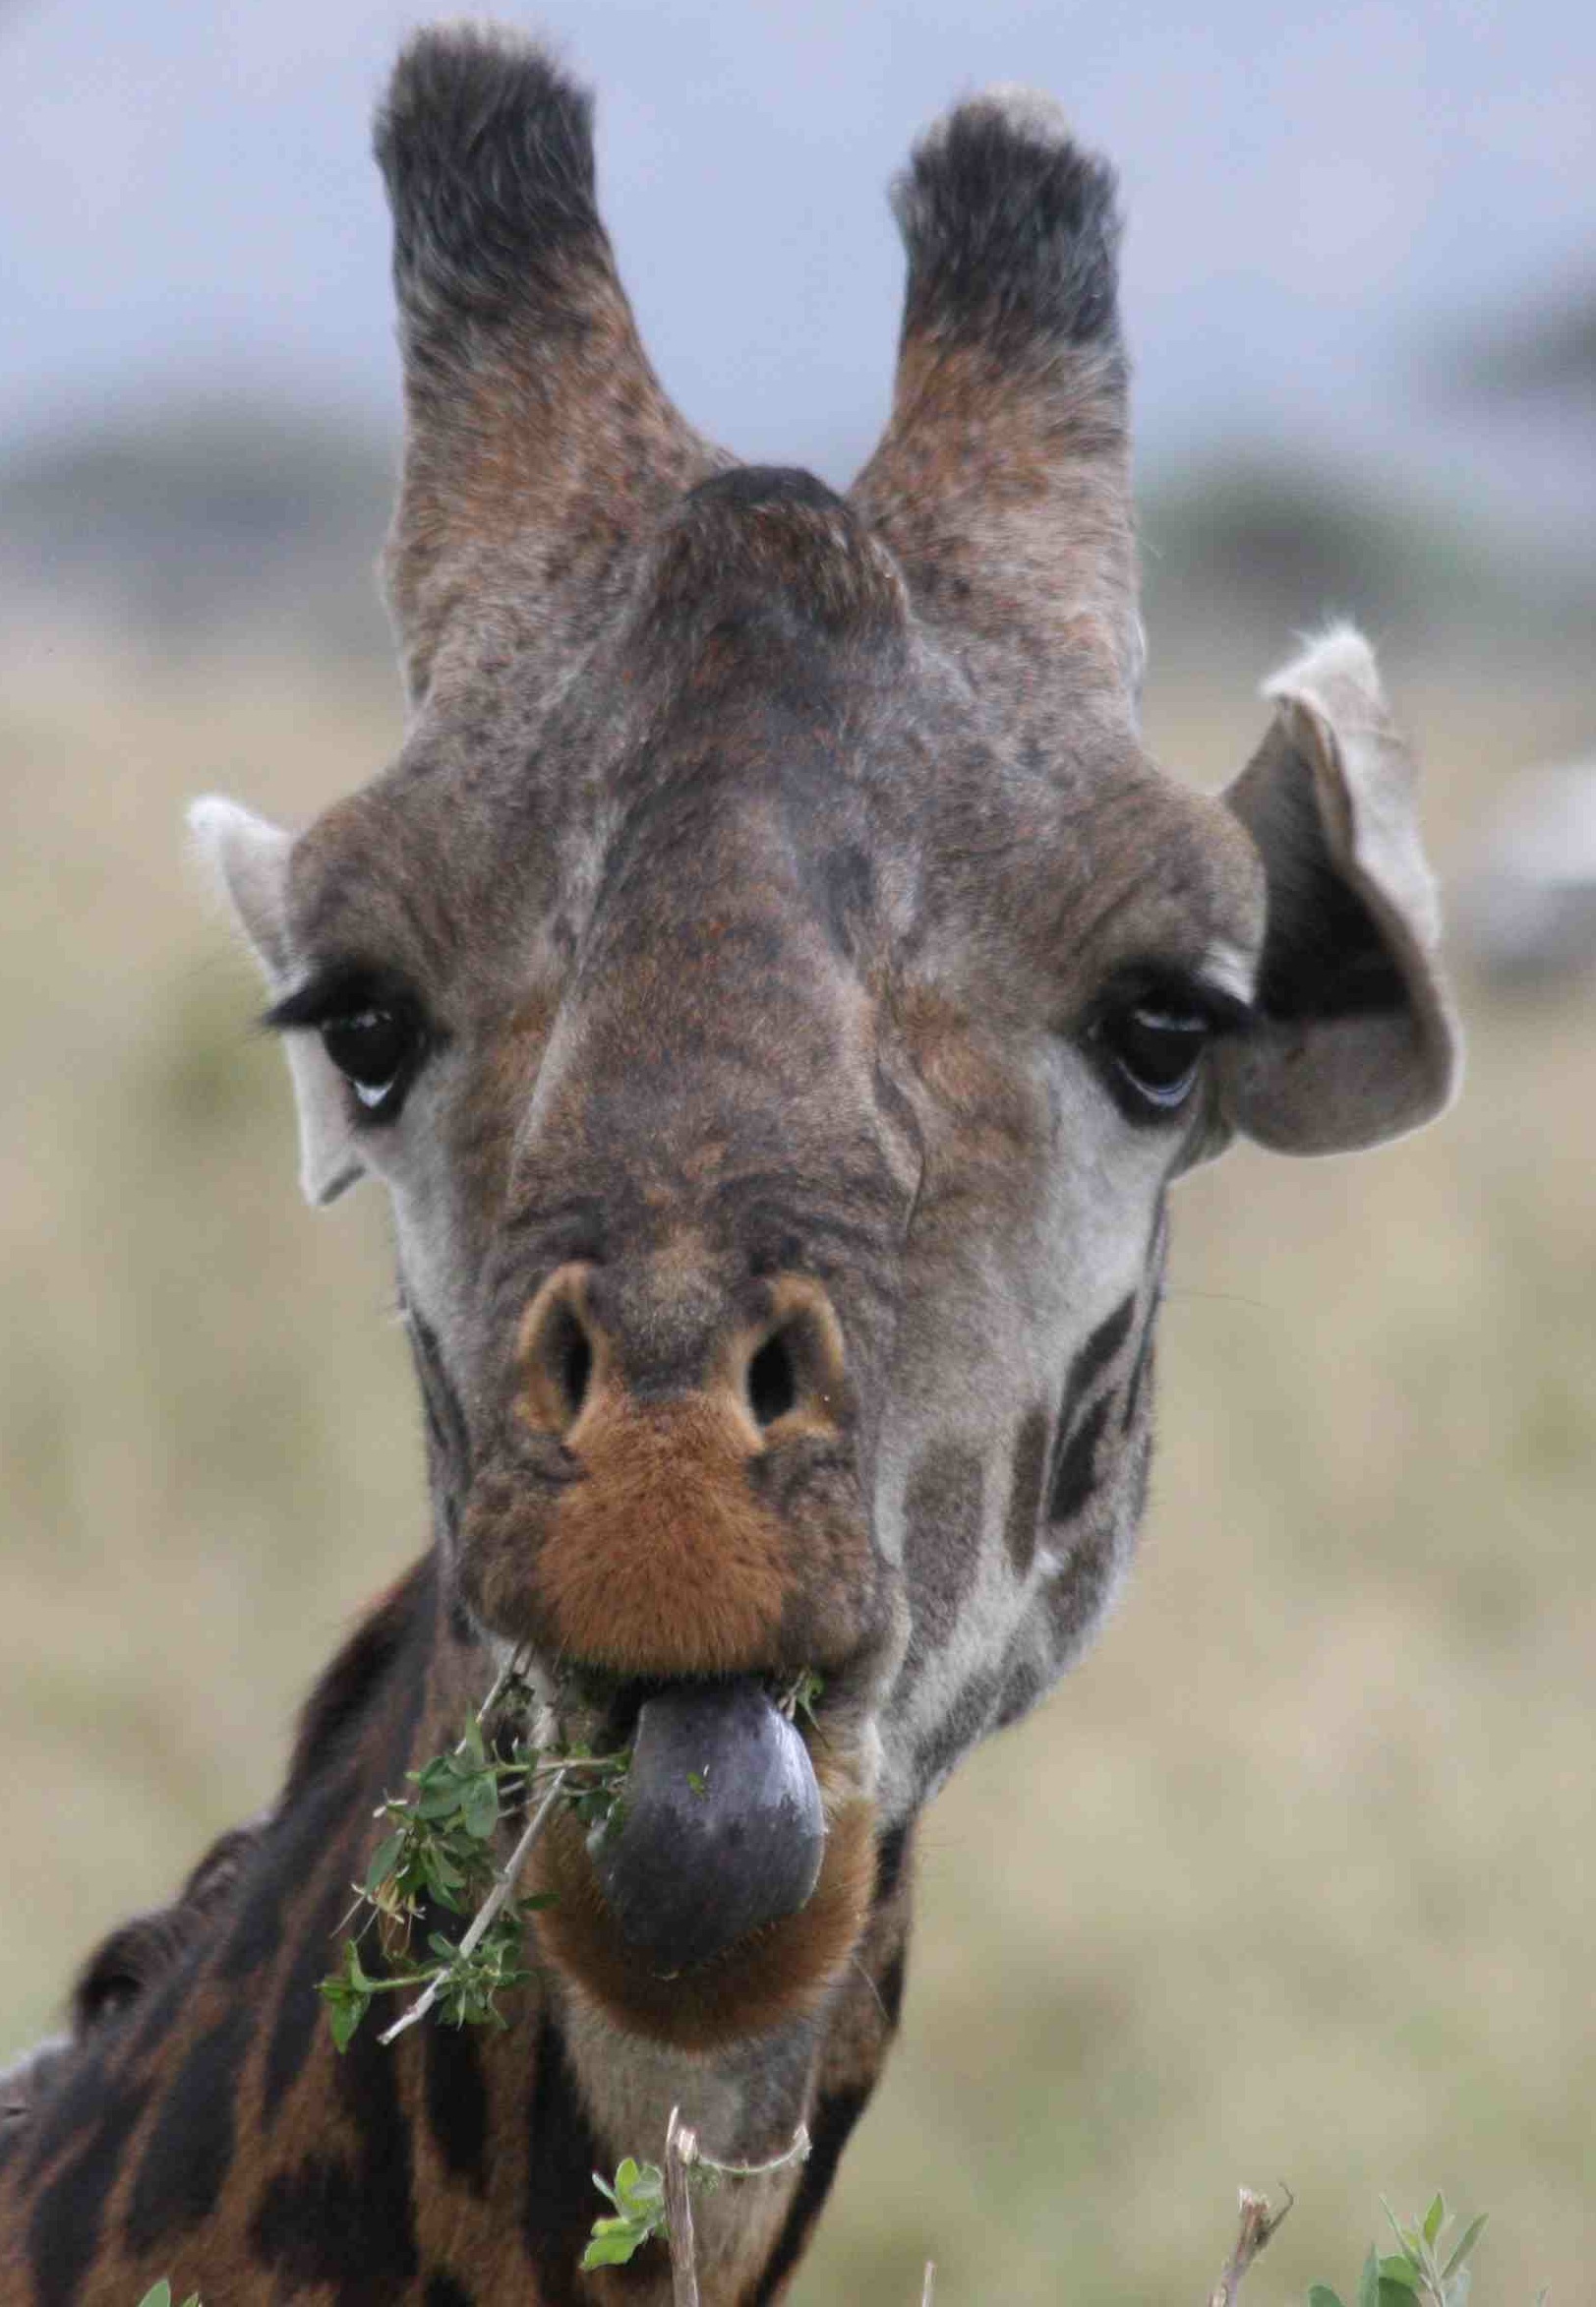
We can learn a lot by keeping track of individual giraffes. Luckily, it turns out that each giraffe is born with a unique set of coat markings that persist throughout life, like human fingerprints or lion whisker spots. So, each field season, I arrived in Serengeti stocked with the materials necessary to catalogue the many giraffes I would encounter: several hundred 5 x 8 index cards, ink cartridges for the printer, sharp scissors, and a good supply of glue sticks. My days in the field often went as follows. Morning and afternoon: meander through the woodlands locating and photographing giraffes. Evenings: work through the day’s photographs, identifying giraffes and making ID cards for any new individuals. For fun, I assigned a different first name to each individual. The female below is named Flopsy, for her deformed right ear:


Among Serengeti giraffes, which belong to the Masai subspecies, coat markings vary from blocky to highly stellate, or star-like. While the patterns do not change, the color of the markings can grow darker as giraffes age, particularly for males. The shape, color and arrangement of the coat markings are all useful for telling apart different individuals. Other traits are useful as well, such as tail length or ossicone size, shape and hairiness. (Ossicone is the name for the bony, skin-covered horns of a giraffe.) I’ve included some giraffe photos below so you can try your hand at giraffe pattern matching. See if you can match the individual on the top row with any of the individuals in the bottom two rows:

Sexing giraffes is usually easy, especially at close range or from photograph. Aside from the obvious, adult males can be distinguished from females by their larger size, skull ossification (the ossicones of males are larger and mature males acquire additional bony skull protrusions) and their more erect posture. Sexing young calves is a bit trickier. The genitals of male calves are small and calves aren’t always willing to pose for the camera.
Here is an example of a mature male giraffe with significant skull ossification:

By the end of my 2010 field season, I’d amassed a catalogue of almost 1,000 giraffes. (Identifying giraffes by eye can be a laborious and error-prone process but Doug Bolger and colleagues at Dartmouth University have now released Wild-ID, software that assists with giraffe pattern recognition.
We are hoping that we can use the plentiful giraffe images coming in from the camera trap study to maintain this giraffe database and to monitor the population. It turns out, though, that many of the camera trap images contain only giraffe legs, which are much harder to use for identification than flanks.

Lions and Wolves: Hunting and Conservation
Lion hunting is an active sport in Africa, with wealthy foreigners paying thousands of dollars for a chance to kill a lion and take its skin back home to taxidermy. Done right, lion hunting could benefit the species, by helping to pay for land protection and other conservation measures. However, too often it is done poorly.

For many years, Craig has been actively involved in figuring out how to do lion hunting sustainably. In 2009, he, Ali, and I, and a bunch of others wrote a paper (“Sport Hunting, Predator Control and Conservation of Large Carnivores”) about the pressures and dynamics of hunting large carnivores with a focus on lions and wolves. If you’re not a hunter yourself, you may believe that hunting and conservation are diametrically opposed to one another. But that’s not true; most hunters are also conservationists and many of the strongest wildlife protection laws in our country were championed by hunters. In our paper we explore the complexities that arise when you add the third party: not just hunters and conservationists, but also rural citizens, and particularly ranchers. While hunters want to maintain wildlife (to hunt, and often for other reasons as well), ranchers would be most happy if there were no predators around at all; predators like lions and wolves kill livestock and even threaten rural people. Wildlife managers then have the unhappy task of trying to please all three groups, and they often do so by employing hunters to maintain lower than full capacity predator populations.
Late last year, the U.S. Fish and Wildlife Service responded to a petition to list African lions as endangered species, which would prohibit the importation into the U.S. of lion trophies. This week the Tanzanian Ministry of Natural Resources and Tourism wrote an opinion piece in the New York Times about it, saying that doing so would cripple Tanzania’s ability to protect lions and other wildlife. Our intrepid safari reporter Chris Egert followed up with Craig on KSTP to get his take on the controversy. What do you think? Should the U.S. prohibit the importation of lion trophies? What do you think about hunting as a component of conservation? What can be done to reduce the conflict between large carnivores and the people who live (and tend livestock) near them? These are not questions with easy answers, and I’m curious to hear what Snapshot Serengeti fans think.
Game Plan
Way back in the earliest days, before we had met Zooniverse, Ali, I, and several undergraduates were brainstorming a website. Ali had already put together an interface to enable her assistants to help identify images, and it was successful enough that we knew that a website would work. But her existing interface was not scalable to large numbers of people, and we wanted to get the general public involved. So what to do?
Since we wanted people to stick around on our website for a while, we decided that we ought to embed the animal identification process in a game. We thought about several different game types, including adventure games, ones in which players “collect” the animals they identify, and even puzzle games. Here is a mock screenshot of one adventure game we imagined:

In this one, the idea was that you played as if you were an animal. Here you’re a lion with giraffe and porcupine sidekicks. You’d get a series of challenges based on the life of your character. For example, as a young lion, you’d learn to hunt for food. To do so, you’d identify animals in images and add them to a temporary collection (at bottom right). If enough people agreed with you about the identification, the image would become available to satisfy the challenge. So if the identified animal was a Thomson’s gazelle for instance, you’d be able to cash it in to satisfy the “learn to hunt” challenge. Once you’d accumulated enough prey items, you’d get a new challenge or you could switch to a different character. We envisioned various score metrics – a percent of images identified “correctly”, a count of images identified, and some sort of score that took into account how many challenges you had completed. We also thought about a social component where users could showcase their finds, trade collected animals, and chat with one another.
Of course, there were drawbacks to this sort of game. You’ll notice that there’s no way to indicate the number or behavior of animals in the images, and we hadn’t yet come up with a way to deal with the sets of three images that usually get taken during the daytime. We also worried about perverse incentives: we imagined someone so intent on winning, that they mis-identified images so as to more quickly accomplish the challenges.
It was François Boucher-Genesse who first suggested to us that a game concept might not be necessary. François consults for the Center for Game Science at the University of Washington, which is known for its acclaimed science game Foldit. I had contacted him to understand more about how to design a good science game. But he pointed out that in our case, a game hid the scientific side of the endeavor and played down the usefulness of identifying the images. He pointed out that the images were compelling enough that a game might not be necessary.
Soon afterwards, we were contacted by Jonathan Brier, a social computing researcher who had come across Ali’s original small-scale interface. He introduced us to the Zooniverse. And the rest, as they say, is history.
Sequestration, Science, and Snapshot Serengeti
Even if you live outside the U.S., it’s been hard to miss the arrival of the dreaded sequester. However, the impact of sequestration on science research doesn’t get a lot of attention in the general din. The U.S. government funds almost all of the nation’s basic science research, which means science research that doesn’t have an immediate application like creating a new medicine or figuring out how to grow crops to withstand drought.
Much of ecology research is basic. In Snapshot Serengeti, we’re interested in learning how a large assemblage of animals coexist and use the landscape. The results will not have an immediate impact on how the Serengeti is managed, but we hope it will help inform conservation management decisions down the line.

Worth funding?
Most of the nation’s basic research – and much applied research – is being cut by approximately 8%. Now, science funding hasn’t been doing all that well over the past couple decades anyway. And now things are getting worse. Snapshot Serengeti and its parent organization, the Lion Research Center, are mainly funded by the National Science Foundation (NSF), which announced recently that it will award 1,000 fewer grants this year than anticipated.
You may remember that in January, we were working hard on a grant proposal to keep our cameras rolling past the end of 2012. The way the process works is that each proposal gets evaluated on whether it is good, well-planned, and worthwhile science and either gets recommended for funding or rejected. To give you an idea, in our division of the NSF, 16% of proposals got recommended for funding last year.
But it doesn’t end there. Each year the NSF gets many more good, well-planned, and worthwhile proposals than it can fund. So it ranks them. And then it starts funding them, starting at the top and moving down the list, until it runs out of money. Of the recommended proposals, NSF expected to be able to fund just the top 22% of them this year.
And with sequestration, that pot of available money just got even smaller.
What that means for our proposal isn’t clear yet. If the sequester sticks, then we will be competing for a smaller pot of next year’s NSF money. And even if it doesn’t, we’ll be in tighter competition with all those really good proposals from this year that just missed out on getting funded. In either case, the sequester is bad news for Snapshot Serengeti.
Trees
The rain is crazy. Not as windy as yesterday, when it blew our furniture off the veranda, but crazy nonetheless. I could see it coming, not just your typical clouds stretching to the earth in the distance – I could see the waves of water hitting the ground between the scattered trees, moving closer with every second. It was a race – I wanted to reach the valley, with its low profile and scattered trees, before the storm reached me. I know that in a lightening storm, you’re not supposed to seek shelter beneath a tree. But in my giant Landrover, with its 4.5 foot antennae beckoning to the sky, I don’t like being the only blip on the plains. Logical or not. (Comments from lightning experts welcome.)
And so here I am. Somewhere between cameras L05 and L06, hunkered down as the torrents of water wash over Arnold & me. The endless tubes of silicone sealant have done their job – most of me, and most of my equipment, is dry – there are only two leaks in the roof.
The sky is gray for miles – I am done for the day. It’s only 5pm! In wet season, I can normally work until 7pm, and still prep my car for camping before it’s too dark to see. Today feels like one of those cherished half-days from elementary school – not as magical as a snow day, mind you, but exciting nonetheless. Except I am trapped in my car…
So, with that, I open a beer, shake out the ants and grass clippings from my shirt, and hunker down in the front seat to wait out the rain. And to think. I’ve been thinking a lot about trees lately. Mostly what they mean for the how the carnivores are using their landscape.
See, from the radio-collaring data, we know that lions are densest in the woodlands. Living at high densities that is, not stupid. But the cameras in the woodlands don’t “see” lions very well. Out on the plains, a lone tree is a huge attractant. It’s the only shade for miles, the only blip on the horizon. All the carnivores, but expecially the musclebound, heat-stressed lions, will seek it out. In contrast, in the woodlands, even though there are more lions, the odds of them walking in front of the one of 10,000 trees that has my camera on it are…slim.
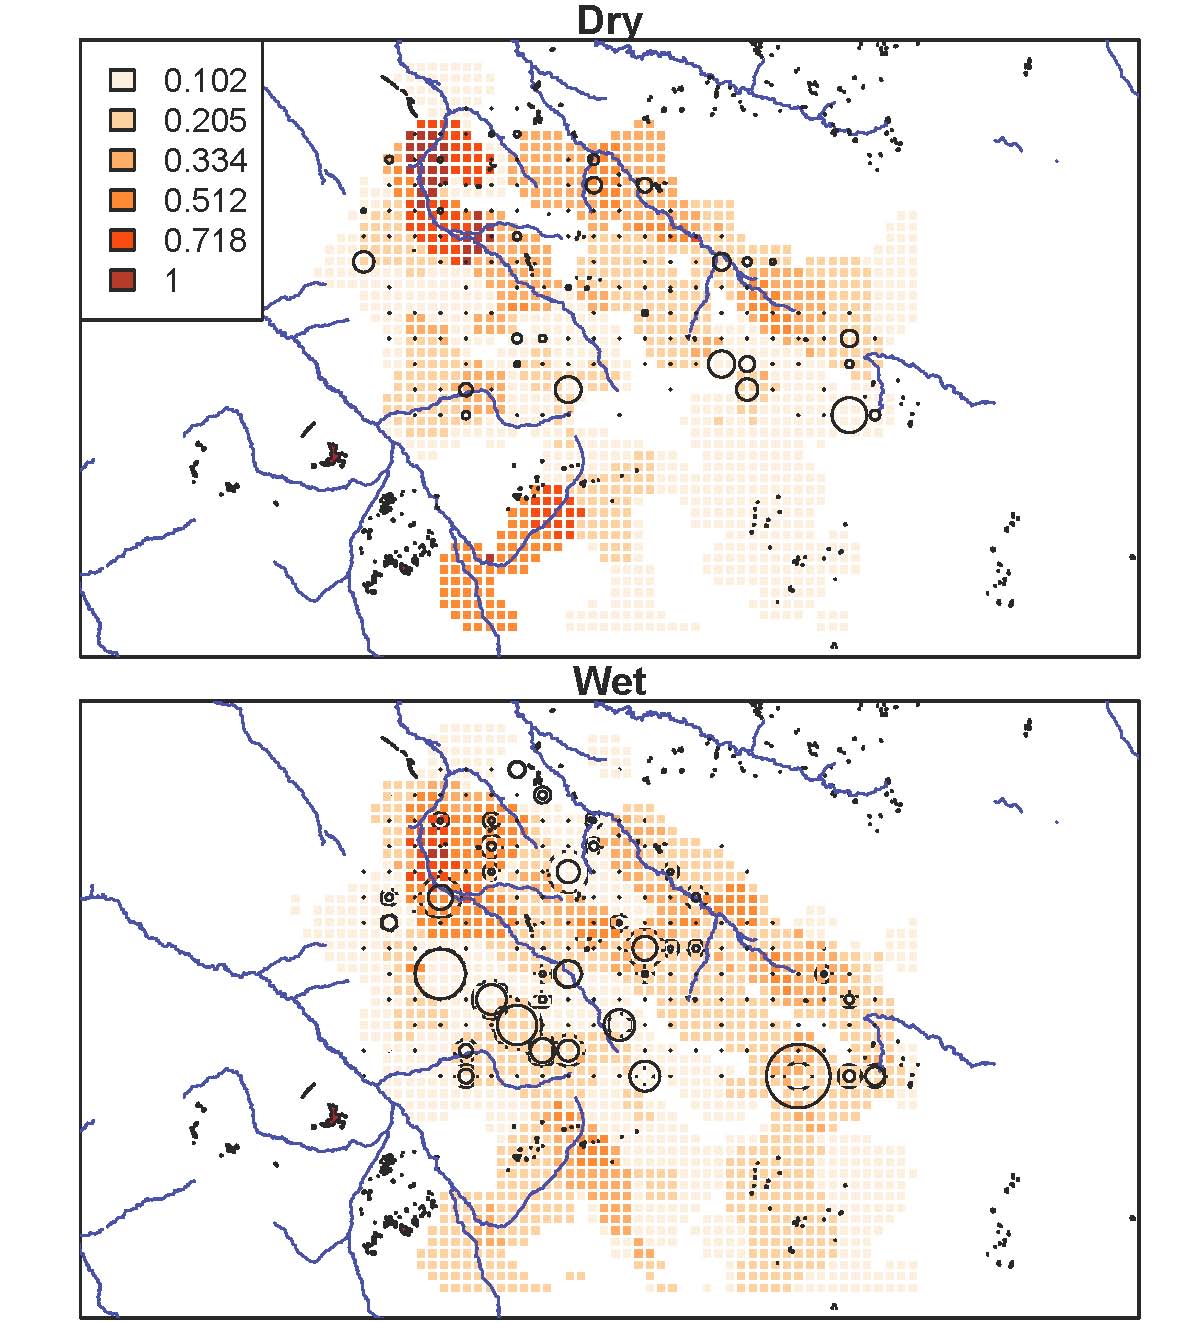
This map is one of many I’ve been making the last week or so. Here, lion densities, as calculated from radiocollar data, are the red background cells; camera traps are in circles, sized proportionally to the number of lions captured there. As you can see, the sheer number of lions captured in each camera trap doesn’t line up especially well with known lion densities. Disappointing, but perhaps unsurprising. One camera really only captures a very tiny window in front of it – not the whole 5km2 grid cell whose center it sits in. One of my goals, therefore, is to use what we know about the habitat to align the camera data with what we know about lion ranging patterns. I think the answer lies in characterizing the habitat at multiple different spatial scales – spatial scales that matter to the decision-making of a heat-stressed carnivore who sees blips on the horizon as oases of shade. And so I’m counting trees. Trees within 20 meters, 50 meters, 200 meters of the camera. One tree in a thick clump is still pretty attractive if that clump is the only thing for miles. Once I can interpret the landscape for lions, once I can match camera data with what we know to be true for lion ranging, I can be comfortable interpreting patterns for the other species. I hope.
The rain is letting up now, and it’s getting dark. Time to pack the car for camping – equipment on the roof and in the front seat. Bed in the back. And a sunset to watch with beer in hand.
Better with Practice
This week, I’ve been starting to think about how to approach those “hard to figure out” images. Now, of course, some of them are going to be impossible images – those that are so far away or close or off the edge that even an expert could not accurately identify the species in them. But some of them are just tricky images that an expert could identify, but would be difficult for someone just starting out with Snapshot Serengeti to figure out.
So here’s a thought: do Snapshot Serengeti volunteers get better at classifying over time? If so, then we should see that, on average, volunteers who have classified more images have a higher batting average than those who have classified fewer images. And if that’s the case, maybe we could use this information to help with the “hard to figure out” images; maybe we could take into account how experience a volunteer is when they classify one of these tricky ones.
To see if volunteers get better at classifying with more experience, I took the data from Season 4 that I’ve written about the past couple weeks, and looked at how well volunteers did based on how many Season 4 images they had classified. Of course, this isn’t perfect, as someone could have gotten a lot of experience with Seasons 1-3 and only just done a little bit on Season 4. But I’m going to assume that, in general, if someone with a lot of early-on experience came back to do Season 4, then they did a lot of images in Season 4, too.
And here’s the answer: yes, volunteers do get better with experience. (Click on it to make it bigger.)
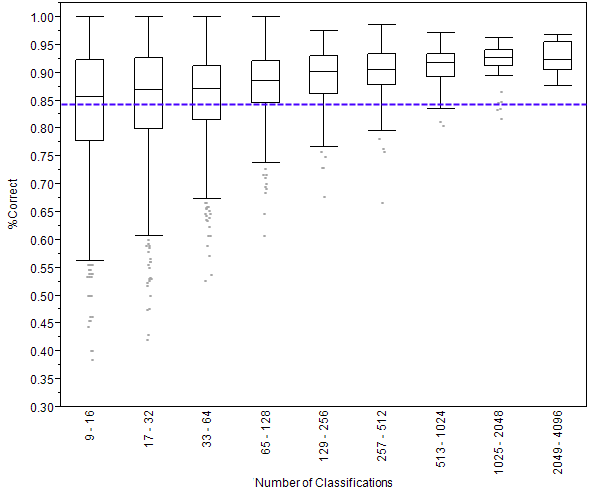
What you see above is called a box plot. On the left side is the percentage of images that were classified correctly. A 1.00 would be perfect and 00.0 would be getting everything wrong. Then you see nine rectangles going across. Each of these is called a box. The key line to look at in these boxes is the one that crosses through the middle. This line shows the median score. Remember that the median score is the score of the person in the very middle of the line if we were to line up everyone by how well they did. (Want to learn more about box plots?)
I’ve divided volunteers into these nine boxes, according to how many classifications they made. The number of classifications is written sideways at the bottom. So, for example, the leftmost box shows the scores of people who made 9 to 16 classifications. You can see that as the number of classifications gets bigger (as we go from left to right on the graph) the scores go up. Someone who does just 14 classifications gets 12 of them right, on average, for a score of 86%. But someone who does 1400 classifications gets 1300 of them right on average, for a score of 93%.
Finally, the purple dashed line shows the average score of all the anonymous volunteers – those that don’t create a user name. We know that these volunteers tend to do fewer classifications than those who create accounts, and this graph shows us that volunteers who create user names score better, on average, than those who don’t.
On a completely different note, if you haven’t seen it already, Rob Verger wrote a really nice piece on Snapshot Serengeti over at the Daily Beast. I recommend checking it out.
Or, read on for details on how I made this graph.
The Night Belongs to the Lions
Lions are a different species at night. During the day, they must remain hidden from their prey. But there is nothing secretive about a lion’s behavior on a moonless night. There is no skulking, no need to hide. The lions own the darkness.
The Kalahari Bushmen still live the traditional hunter-gatherer lifestyle of our ancestors, and they frequently hunt at night – but only when the moon is above the horizon and bright enough for human eyes to detect shapes and movements. Without the light of the moon, say the Bushmen, the night belongs to the lions. So they divide the night with the lions according to the phase of the moon.
And if there is a lunar eclipse? That is just a hungry lion, placing her paw in front of the full moon, stealing a little extra darkness.

The Serengeti lions don’t feed well on moonlit nights. Lions have fuller bellies around the new moon; they are thinnest at the full moon. To compensate, they scavenge or hunt more during daylight hours. Wild herbivores are available to lions throughout the night, no matter what the moon is doing. However, humans universally stay up until around 10:00 pm or so and sleep until sunrise. If we’re going to be out and about at night, we’re out in the evening not before dawn.
By the full moon, the hours after sunset are so bright that you can read a newspaper. But the next night, the moon doesn’t rise until an hour after sunset; by the fourth night, the darkness persists for over three hours before the moon finally rises.
Outbreaks of man-eating lions have killed hundreds of people in southern Tanzania over the past twenty years. These are agricultural areas where lions mostly survive on bush pigs – agricultural pests that cause people to sleep in their fields to protect their harvests. Thus pigs provide the link between lions and vulnerable humans.
Former graduate students Hadas Kushnir and Dennis Ikanda visited survivors and victims’ families and recorded the precise time and date of 450 attacks on humans. Most occurred between sunset and 10:00 pm, and while the last few nights before the full moon were the safest, the first few nights after the full moon were three-and-a-half times more dangerous. After enduring the bright evenings prior to the full moon, the lions were hungry, and they mostly attacked people upon the return of evening darkness.
The full moon can feel spooky, and humans have constructed moon-related myths about werewolves and lunacy and Halloween. But there is no linkage between moon phase and suicide or admission to psychiatric institutions.
So what if the full moon doesn’t make you crazy but just makes you nervous? What if it keeps you safely indoors for a couple of nights?
The full moon isn’t dangerous in itself, but after a few million years of dividing our nights with lions, it would be surprising if we didn’t somehow sense the monthly dividing line between our time and lion time.
—
Here you can read the original research article about lions and the full moon.
The Wrong Answers
Ever since I started looking into the results from Season 4, I’ve been interested in those classifications that are wrong. Now, when I say “wrong,” I really mean the classifications that don’t agree with the majority of volunteers’ classifications. And technically, that doesn’t mean that these classifications are wrong in an absolute sense — it’s possible that two people classified something correctly and ten people classified it wrong, but all happened to classify it wrong the same way. This distinction between disagreement with the majority and wrong in an absolute sense is important, and is something I’m continuing to explore.
But for right now, let’s just talk about those classifications that don’t agree with the majority. To first look at these “wrong” classifications, I created what’s called a heat map. (Click to make it bigger.)

This map shows all the classifications made in Season 4 for images with just one species in it. (More details on how it’s made at the end, for those who want to know.) The species across the bottom of the map are the “right” answers for each image, and the species along the left side are all the classifications made. Each square represents the number of votes for the species along the left side in an image where the majority voted for the species across the bottom. Darker squares mean more votes.
So, for example, if you find aardvark on the bottom and look at the squares in the column above it, you’ll see that the darkest square corresponds to where there is also aardvark on the left side. This means that for all images in which the majority votes was for aardvark, the most votes went to aardvark — which isn’t any surprise at all. In fact, it’s the reason we see that strong diagonal line from top left to bottom right. But we can can also see that in these majority-aardvark images, some people voted for aardwolf, bat-eared fox, dik-dik, hare, striped hyena, and reedbuck.
If we look at the heat map for dark squares other than the diagonal ones, we can see which animals are most likely confused. I’ve circled in red some of the confusions that aren’t too surprising: wildebeest vs. buffalo, Grant’s gazelle vs. Thomson’s gazelle, male lion vs. female lion (probably when only the back part of the animal can be seen), topi vs. hartebeest, hartebeest vs. impala and eland(!), and impala vs. Grant’s and Thomson’s gazelle.
In light blue, I’ve also circled a couple other interesting dark spots: other-birds being confused with buffalo and hartebeest? Unlikely. I think what’s going on here is that there is likely a bird riding along with the large mammal. Not enough people classified the bird for the image to make it into my two-species group, and so we’re left with these extra classifications for a second species.
It’s also interesting to look at the white space. If you look at the column above reptiles, you see all white except for where it matches itself on the diagonal. That means that if the image was of a reptile, everyone got it. There was no confusing reptiles for anything else. Part of this is that there are so few reptile images to get wrong. You can see that wildebeest have been misclassified as everything. I think that has more to do with there being over 17,000 wildebeest images to get wrong, rather than wildebeest being particularly difficult to identify.
What interesting things do you see in this heat map?
(Read on for the nitty gritty or stop here if you’ve had enough.)
Some Results from Season 4
I was asked in the comments to last week’s blog post if I could provide some feedback about the results of Season 4. If you felt like you were seeing a lot of “nothing here” images, you’re right: of the 158,098 unique capture events we showed you, 70% were classified as having no animals in them. That left 47,320 with animals in them to classify, and the vast majority of these (94%) contained just one species. Here’s the breakdown of what was in all those images:

Maybe it won’t surprise you that Season 4 covered 2012’s wet season, when over a million wildebeest, zebra, and Thomson’s gazelle migrate through our study area. I find it interesting that hartebeest are also pretty numerous, but I wonder if it’s because of that one hartebeest that stood in front of the camera for hours on end.
This pie chart is based on the number of what we call “capture events,” which is the set of 1 or 3 pictures you see every time you make a classification. Once a camera has taken a set of pictures, we delay it from triggering again for about a minute. That way we don’t fill up the camera’s memory card with too many repeats of the same animals before we have a chance to replace them. But a minute isn’t a very long time for an animal that has decided to camp out in front of a camera, and so we frequently get sequences of many capture events that are all of the same animal. One of the things we’ll have to do in turning your classifications into valid research results is to figure out how to find these sequences in the data automatically.
Here’s a sequence of an elephant family hanging out around our camera for the night about a year ago. (Hat tip to dms246 who put together a collection of most of these images to answer the concerned question of some classifiers who saw just one image out of the whole sequence: is that elephant dead or just sleeping?)
1, 2, 3, 4, 5, 6, 7, 8, 9, 10, 11, 12, 13, 14, 15, 16, 17, 18, 19, 20, 21, 22, 23, 24, 25, 26, 27, 28, 29, 30, 31
If you’re interested in how I made the above pie chart, keep reading. But we’re going to get technical here, so if algorithms don’t interest you, feel free to stop.
