
A Young Grad Student’s Project…
Three weeks into graduate school and I’d have to say that it’s been an overwhelming and exciting time thus far. The coursework is intense, the lectures intriguing, and it’s certainly been interesting getting to know the diverse array of people who populate the Ecology, Evolution, and Behavior department. Accomplishment of the week, however, would have to be rounding up some IT guys to fix the lab printer so that I can finally make copies of all the papers I need to be reading! Score.
Even though I’ve just begun at UMN, I had been developing potential research project to do in the Lion Lab over the last several months. While Ali focuses on interactions between different predator species, I will be diving into the interspecies interactions that compose the Serengeti’s predator-prey dynamics. Specifically, I want to look into how physical predation along with the fear of potential predation influence how and where herbivores move throughout the day. Snapshot Serengeti is essential to my research because the camera traps are collecting data on where herbivores are congregating 24/7. Most other studies have been limited to looking at large-scale distributions during the day, whereas we can pick apart fine-scale distribution patterns even during the hours of darkness.
Now the Serengeti and the creatures in it are not static, but move around and prioritize different activities throughout the day. Herbivores are active during the day (diurnal), whereas the major savanna predators are most active in the twilights (crepuscular) and evenings (nocturnal). To avoid predators and maximize resource intake, herbivores could be strategizing about what they do and when they do it. I want to look at where the prey herbivores are during different times of the day and see if and how this changes throughout the 24-hour cycle in. If it does, we can then move into examining different hypotheses and motivating factors for these particular movement patterns.
One thing I would like to do is use lion behavioral data from the Serengeti Lion Project to construct a map of predator “attack risk” – a diagram showing the areas which include landscape features that are known to increase predator attack success. Another kind of map I can construct is one highlighting areas of prime resources based off of information on different herbivore species’ primary diets. This would reveal where herbivores should be going if they were focused solely on resource acquisition. The camera traps provide yet another layer by showing us where the herbivores ARE actually spending their time, and we can compare this (actual) distribution to those predicted by the two mentioned models.
Studies like this would not be possible without the novel type of information being generated by the camera traps. Being able to pull information from the pictures and add in additional data from the lion behavior projects, I have a good chance of being able to reveal something interesting about the dynamic interactions being hashed out in the Serengeti.
Handling difficult images
From last week’s post, we know that we can identify images that are particularly difficult using information about classification evenness and the fraction of “nothing here” votes cast. However, the algorithm (and really, all of you volunteers) get the right answer even on hard images most of the time. So we don’t necessary want to just throw out those difficult images. But can we?
Let’s think about two classes of species: (1) the common herbivores and (2) carnivores. We want to understand the relationship between the migratory and non-migratory herbivores. And Ali is researching carnivore coexistence. So these are important classes to get right.
First the herbivores. Here’s a table showing the most common herbivores and our algorithm’s results based on the expert-classified data of about 4,000 images. “Total” is the total number of images that our algorithm classified as that species, and “correct” is the number of those that our experts agreed with.
| species | migratory | total | correct | % correct |
| wildebeest | yes | 1548 | 1519 | 98.1% |
| zebra | yes | 685 | 684 | 100% |
| hartebeest | no | 252 | 244 | 96.8% |
| buffalo | no | 219 | 215 | 98.2% |
| gazelleThomsons | yes | 200 | 189 | 94.5% |
| impala | no | 171 | 168 | 98.3% |
We see that we do quite well on the common herbivores. Perhaps we’d wish for Thomsons gazelles to be a bit higher (Grants gazelles are most commonly mis-classified as Thomsons), but these results look pretty good.
If we wanted to be conservative about our estimates of species ranges, we could throw out some of the images with high Pielou scores. Let’s say we threw out the 10% most questionable wildebeest images. Here’s how we would score. (Note that I didn’t do the zebra, since they’d be at 100% again, no matter how many we dropped.) The columns are the same as the above table, except this time, I’ve listed the threshold Pielou score used to throw out 10% of the images of that species.
| species | Pielou cutoff | total | correct | % correct |
| wildebeest | 0.60 | 1401 | 1389 | 99.1% |
| hartebeest | 0.73 | 228 | 223 | 97.8% |
| buffalo | 0.76 | 198 | 198 | 100% |
| gazelleThomsons | 0.72 | 180 | 175 | 97.2% |
| impala | 0.86 | 155 | 153 | 98.7% |
We do quite a bit better with our Thomsons gazelle and increase the accuracy of all the other species at least a little. But do we sacrifice anything throwing out data like that? If wildebeest make up a third of our images and we have a million images, then we’re throwing away 33,000 images(!), but we still have another 300,000 left to do our analyses. One thing we will look at in the future is how much dropping the most questionable images affects estimates of species ranges. I’m guessing that for wildebeest it won’t be much.
What if we did the same thing for Thomsons gazelle or impala? We would expect about 50,000 images of each of those per million images. Throwing out 5,000 images still leaves us with 45,000, which seems like it might be enough for many analyses.
Now let’s look at the carnivore classifications from the expert-validated data set:
| species | total | correct | % correct |
| hyenaSpotted | 55 | 55 | 100% |
| lionFemale | 18 | 18 | 100% |
| cheetah | 6 | 6 | 100% |
| serval | 6 | 6 | 100% |
| leopard | 3 | 3 | 100% |
| jackal | 2 | 2 | 100% |
| lionMale | 1 | 1 | 100% |
| aardwolf | 1 | 1 | 100% |
| batEaredFox | 1 | 0 | 0% |
| hyenaStriped | 1 | 0 | 0% |
Wow! You guys sure know your carnivores. The two wrong answers were the supposed bat-eared fox that was really a jackal and the supposed striped hyena that was really an aardwolf. These two wrong answers had high Pielou scores: 0.77 and 0.83 respectively.
Judging by this data set, about 2.5% of all images are carnivores, which gives us about 25,000 carnivore images for every million we collect. That’s a lot of great data on these relatively rare animals! But it’s not so much that we want to throw any of it away. Fortunately, we won’t have to. We can use the Pielou score to have an expert look at the most difficult images.
Let’s say Ali wants to be very confident of her data. She can choose the 20% most difficult carnivore images — which is only about 5,000 per million images, and she can go through them herself. Five thousand images is nothing to sneeze at, of course, but the work can be done in a single day of intense effort.
In summary, we might be able to throw out some of the more difficult images (based on Pielou score) for the common herbivores without losing much coverage in our data. Further analyses are needed, though, to see if doing so is worthwhile and whether we lose anything by throwing out so many correct answers. For carnivores, the difficult images can be narrowed down sufficiently that an expert can double-check them by hand.
Certainty score
Back in June, I wrote about algorithms I was working on to take the volunteer data and spit out the “correct” classification of for each image. First, I made a simple majority-rules algorithm and compared its results to several thousand classifications done by experts. Then, when the algorithm came up with no answer for some of the images (because there were no answers in the majority), I tried a plurality algorithm, which just looked to see which species got the most votes, even if it didn’t get more than half the votes. It worked well, so I’m using the plurality algorithm going forward.
One of the things I’ve been curious about is whether we can detect when particular images are “hard.” You know what I mean by hard: animals smack up in front of the camera lens, animals way back on the horizon, animals with just a tip of the ear or a tuft of tail peeking onto the image from one side, animals obfuscated by trees or the dark of night.
So how can we judge “hard”? One way is to look at the “evenness” of the volunteer votes. Luckily, in ecology, we deal with evenness a lot. We frequently want to know what species are present in a given area. But we also want to know more than that. We want to know if some species are very dominant in that area or if species are fairly evenly distributed. For example, in a famous agricultural ecology paper*, Cornell entomologist Richard Root found that insect herbivore (pest) species on collard greens were less even on collards grown in a big plot with only other collards around versus on those grown in a row surrounded by meadow plants. In other words, the insect species in the big plot were skewed toward many individuals of just a few species, whereas in the the meadow rows, there were a lot more species with fewer individuals of each species.
We can adopt a species evenness metric called “Pielou’s evenness index” (which, for you information theorists, is closely related to Shannon entropy.)
[An aside: I was surprised to learn that this index is named for a woman: Dr. Evelyn Chrystalla Pielou. Upon reflection, this is the first time in my 22 years of formal education (in math, computer science, and ecology) that I have come across a mathematical term named for a woman. Jacqueline Gill, who writes a great paleo-ecology blog, has a nice piece honoring Dr. Pielou and her accomplishments.]
Okay, back to the Pielou index: we can use it to judge how even the votes are. If all the votes are for the same species, we can have high confidence. But if we have 3 votes for elephant and 3 votes for rhino and 3 votes for wildebeest and 3 votes for hippo, then we have very low confidence. The way the Pielou index works out, a 0 means all the votes are for the same species (high skew, high confidence) and a 1 means there are at least two species and they all got the same number of votes (high evenness, low confidence). Numbers in between 0 and 1 are somewhere between highly skewed (e.g. 0.2) and really even (e.g. 0.9).
Another way we could measure the difficulty of an image is to look at how many people click “nothing here.” I don’t like it, but I suspect that some people use “nothing here” as an “I don’t know” button. Alternatively, if animals are really far away, “nothing here” is a reasonable choice. We might assume that the percentage of “nothing here” votes correlates with the difficulty of the image.
I calculated the Pielou evenness index (after excluding “nothing here” votes) and the fraction of “nothing here” votes for the single-species images that were classified by experts. And then I plotted them. Here I have the Pielou index on the x-axis and the fraction of “nothing here” votes on the y-axis. The small pink dots are the 3,775 images that the algorithm and the experts agreed on, the big blue dots are the 84 images that the plurality algorithm got wrong, and the open circles are the 29 images that the experts marked as “impossible.” (Click to enlarge.)
 And sure enough, we see that the images the algorithm got wrong had relatively high Pielou scores. And the images that were “impossible” had either high Pielou scores or a high fraction of “nothing here” votes (or both). I checked out the four anomalies over on the left with a Pielou score of zero. All four were unanimously voted as wildebeest. For the three “impossibles,” both Ali and I agree that wildebeest is a reasonable answer. But Ali contends that the image the algorithm got wrong is almost certainly a buffalo. (It IS a hard image, though — right up near the camera, and at night.)
So we do seem to be able to get an idea of which images are hardest. But note that there are a lot more correct answers with high Pielou scores and high “nothing here” fractions than errors or “impossibles”. We don’t want to throw out good data, so we can’t just ignore the high-scorers. But we can attach a measure of certainty to each of our algorithm’s answers.
—
Lions, cheetahs, and dogs, oh my! (Continued)
Last month, I wrote about how, despite lions killing cheetah cubs left and right, they don’t seem to be suppressing cheetah population size like they do for wild dogs. And, that despite all this killing, that cheetahs don’t seem to be avoiding lions – but I didn’t have radio-collar data for wild dogs.
Well, now I do!
Although we’ve had collared lions continuously since 1984, Serengeti cheetahs and wild dogs were only collared from 1985-1990. We worked with Tim Caro, former director of the cheetah project, to access the historic cheetah data a year ago, but it was only a month ago that we finally tracked down the historic wild dog data. Thanks to a tip by a former Frankfurt Zoological Society employee, we found the data tucked away in the recesses of one of their Serengeti-based storage containers – and Craig braved a swarm of very angry bees to retrieve it!
The good news is that the data was totally worth it. Just like we suspected, even though cheetahs didn’t seem to be avoiding lions, wild dogs were. This map shows lion densities in the background, with cheetah (in brown dots) and wild dog (black triangles) locations overlaid on the lion densities.
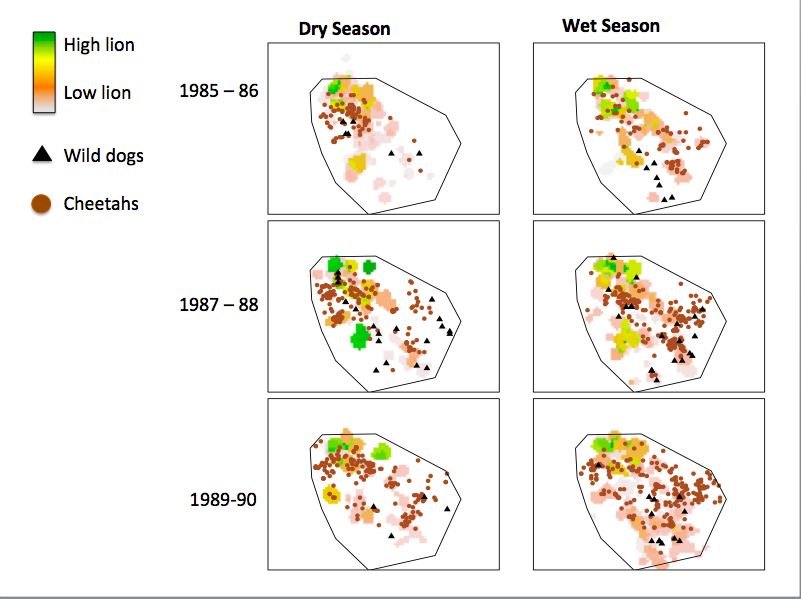
Lions, cheetahs, and wild dogs from when all three species were radio-collared in Serengeti.
It’s a pretty cool contrast. Even though lions kill cheetah cubs left and right, cheetahs do not avoid lions, nor do their populations decline as lions increase. In sharp contrast, wild dogs do avoid lions, and their populations also drop as lions increase. Now, that’s not to say that there weren’t other factors influencing the decline of wild dogs in Serengeti, but across Africa, this pattern seems to hold.
Speaking of wild dogs, has any one seen any in Season 6?
Heating up and keeping cool
I’m just returning from a lovely vacation in Maine, where the air was cool and the crowds few and far between. It may not always be that way.
It’s no secret that over the next several decades, the average temperature in the United States (and in many parts of the world) is going to increase. That means warmer summers, both in the hot parts of the country and in the more northerly regions where people typically go in the summer to cool off. As the summer weather get warmer, more people may head north on vacation, or they may go further north than before. We can expect animals to try to compensate for warmer weather, too.

A hermit crab in a Maine tidal pool. Kinda makes you want to cool off with some Seafloor Explorer, doesn’t it?
The first week of August I was in Minneapolis for the annual meeting of the Ecological Society of America, and I spent Thursday sitting in on two symposiums: “Warming Consumers and their Prey: General Principles and Applications for How Temperature Affects Trophic Interactions” in the morning and “Rapid Climate Change and Species Range Shifts: Observations, Predictions, and Management” in the afternoon.
The morning session was about how warming climate may influence interactions between plants and animals and between animal predators and animal prey. It is not an easy topic, as the relationships among species are complex, and scientists are only starting to understand how warming will affect single species directly (that is, if they don’t interact with other species). One speaker pointed out that while some species might normally adapt to warming or move to cooler areas, having other species around might prevent that adaptation or movement. For example, if you overheat easily and your plant food does not move northward as the climate warms, you cannot very easily move northward to adjust to the changing climate. Another speaker showed that we should think about maximum summer temperatures and minimum winter temperatures, rather than average annual temperature (as is typically done); plants and animals are likely to experience the greatest impact of climate change when they experience unusually hot or unusually cold conditions.
The afternoon session was equally interesting. One speaker talked about how over the past few decades, the ranges of plants and animals studied all over the world are moving towards the poles (north in the northern hemisphere, south in the southern hemisphere), up mountains, and down into deeper water (for aquatic organisms). Another talked about using information from botanical gardens and commercial plant nurseries to understand where some plant species can live and reproduce, even if they’re not native to that area to begin with; this is useful information for predicting how plants might change their ranges in the future.
Regional climate models for East Africa do not suggest that the area is going to get much warmer in the next decades. However, the climate will get more variable, with wetter wet seasons and more frequent droughts. That’s one of the reasons we want to run Snapshot Serengeti for many years. By collecting data over a decade or more, we’re likely to catch at least one drought year and at least one very wet rainy season. If the Serengeti’s future holds more of these extreme climate years, the data from Snapshot Serengeti will help us determine what will happen to the various animals that live there — and in other parts of Africa.
Unanticipated events and the need for long-term studies
In 1994, a terrible disease ripped through the Serengeti, killing lion after lion. By the end of the year, a third of the lions in the Serengeti were dead. The culprit was a virus known as canine distemper, and lions that died of the disease did not die quietly. The symptoms were clear to any observer: facial twitching, disorientation, and eventually convulsive seizures.
The lions in Craig’s study area were not spared, but the data he had been collecting over the previous decades proved invaluable in understanding what happened in 1994.

Using archived blood samples that had originally been taken for genetic analysis, Craig and his colleagues were able to go back and test for a number of viruses. The earliest year blood had been sampled was 1984, but because some of the lions sampled had been ten years old or older, he was able to infer information about when lions had been exposed to viruses as early as 1970.
They found that there had been previous outbreaks of canine distemper in the lions in 1977 and 1981. Because the lions had been studied then, he knew that these outbreaks had not caused large die-offs like the one that occurred in 1994. Instead, he found that by 1994, essentially all lions in Serengeti were free from canine distemper antibodies, meaning that none of the lions had any immunity to the disease. This widespread lack of immunity and a mutation in the virus were thought to have caused so many deaths.
The lion population recovered after the 1994 outbreak. Just years later, though, two “silent” outbreaks hit the population in 1999 and 2006. Unlike the 1994 outbreak, these ones were not noticed at the time because few lions died. They were only detected through blood sample testing. An analysis of the archived blood samples finally revealed the major difference between the canine distemper outbreak that led to massive death and those that did not. High death rates in the 1994 outbreak were due to the simultaneous infection with another disease — a protozoan parasite known as Babesia — that becomes increasingly common during and after major droughts. When Babesia is absent, lions contract canine distemper, but their immune systems fight it and they become immune. When lions are also infected with Babesia, they cannot fight off the canine distemper virus as easily, and more of them get sick and die.
The long-term lion data was also instrumental in understanding the spread of canine distemper in the 1994 outbreak. The disease showed up sporadically in the study area prides, suggesting that lions acquired the disease from an outside source, rather than spreading it from one lion to another. Sophisticated analyses revealed that the origin of the outbreak was likely in domesticated dogs in the human settlements around the Serengeti ecosystem. Further, it is likely that lions acquired the disease repeatedly from hyenas. Hyenas move great distances, use human-inhabited areas around the Serengeti more than lions do, and interact with lions at kills.
Scientists cannot predict major droughts. Nor can they predict wildlife disease outbreaks. It isn’t possible to recreate major droughts with experiments in vast wilderness areas. Nor is it ethical to introduce novel diseases into natural areas in order to understand more about the disease. It is ONLY through long-term research projects like the Serengeti Lion Project that we acquire the data necessary to understand what happens in nature during disease outbreaks, droughts, and other rare, but important events.
Ideally we would like to run Snapshot Serengeti for at least a decade. We want to be able to capture some drought years in our data set, and some years with unusually wet dry seasons. We want our cameras to be running when the next unexpected disease outbreak occurs — in lions or in other species. To those of you have already contributed to our crowd-funding campaign, a heartfelt thank you. If you haven’t yet, and are able, please consider a donation.
To read more about canine distemper, Babesia, and Serengeti lions, check out:
The life of a lion isn’t easy
Hopefully you’ve been enjoying the adventures of the lions that David Quammen has been writing about in this month’s National Geographic. David writes about the dramatic lives of C-boy and Hildur, two very good-looking male lions that roam the Serengeti, and the challenges that they face as male lions trying to survive in the Serengeti. I was in the car with Ingela that day that the Killers nearly destroyed C-boy — it was one of my first days in Serengeti, and one of the many moments that I fell in love with the dramatic lives of the animals there.
There’s a good chance you’ve seen C-boy and Hildur and Killers, as well as all the ladies they’ve been fighting over, in the camera traps. Below is a map of the pride territories overlaid on the Snapshot Serengeti cameras. There are a lot more prides than this, but these are the ones that Nick Nichols and Davide Quammen followed.

SnapshotSerengeti cameras and the lions that David writes about in NatGeo
Jua Kali, where Hildur and C-boy resided in 2009, control just a tiny patch of land in the center of the study area where the Seronera river begins. They spend most of their time in a marshy lowland where those two small tributaries, converge. The marsh has lush grass and standing water, but is just a tiny oasis in the otherwise dry and desolate grassland. It is not the best territory that a lion can have.
After C-boy and Hildure were deposed from Jua Kali, they eventually took over the Vumbi pride. It worked out pretty well for them in the end – the Vumbi’s are not only a bigger pride, but maintain control over the Zebra Kopjes, a suite of rocky outcroppings that provide shade, water, and a vantage point to watch for prey across the open plains. Despite C-boy’s brush with death and his inelegant retreat from power, C-boy and Hildur really haven’t done too badly for themselves.
North of Vumbi, the Kibumbu pride ranges along the Ngare Nanyuki river. When David was writing about our lions, the Killers had recently taken over the Kibumbu pride. Unfortunately, the Kibumbu females had had young cubs fathered by the previous coalition; the Killers would have killed these cubs to bring the Kibumbu females into sexual receptivity. Infanticide is a brutal, but natural part of a lion’s life.
So there it is. The lions that are gracing the pages of this month’s National Geographic magazine are the same ones that you see yawning, sleeping, and stretching in front of the Snapshot Serengeti camera traps. David’s story, and Nick Nichols’ photos, provide an amazing and detailed dive into their lives.
We’re currently raising funds to keep Snapshot Serengeti and the long-term Lion Research Project afloat. Thanks to everyone who has donated so far!
Our lions in National Geographic Magazine
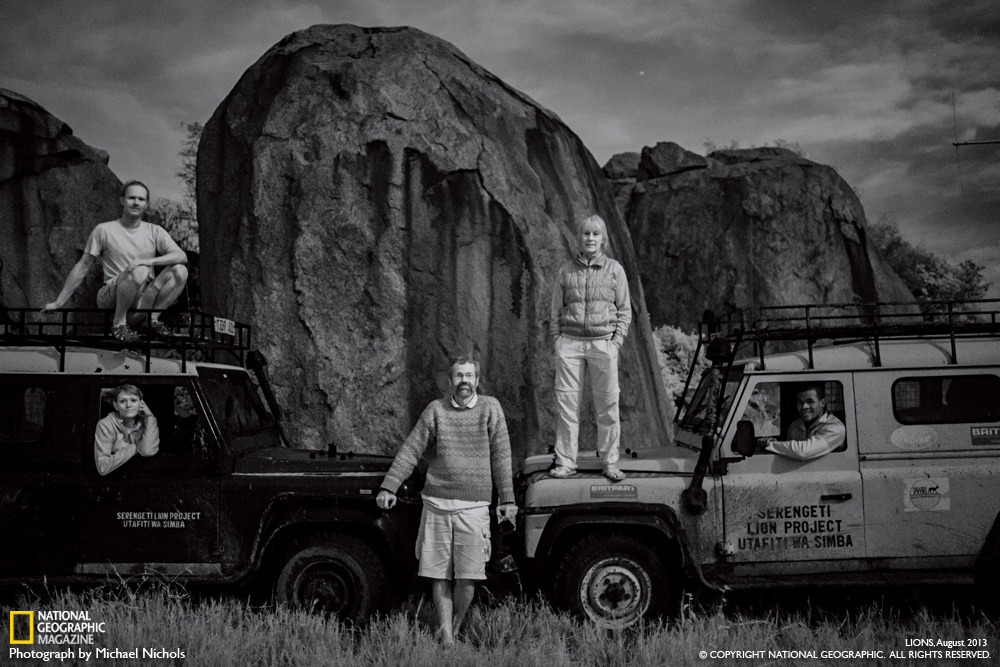
The August edition of National Geographic Magazine has a cover story on the Serengeti lions that Craig has been studying for decades. And because Ali set out the camera trap grid in the same place as Craig’s lion study area, you see the same lions (plus more) on Snapshot Serengeti as those featured in the article. In fact, photographer Michael Nichols was out in the Serengeti during Season 5, so his pictures are contemporaneous with the ones up on Snapshot Serengeti right now.
So if you have a moment, go check out “The Short Happy Life of a Serengeti Lion,” which is entertaining and gives a nice history of the foundational research on which the Snapshot Serengeti science rests. And take a gander at the editor’s note, which accompanies this picture.
Lions, cheetahs, and dogs, oh my! Part 2.
Last week, we left off with this crazy biological paradox: lions kill cheetah cubs left and right, yet as the Serengeti lion population tripled over the last 40 years, cheetah numbers remained stable.
As crazy as it sounds, it seems that that even though lions kill cheetah cubs left and right, it doesn’t really matter for cheetah populations. There are a number of reasons this could be. For example, cheetahs are able to have cubs again really quickly after they lose a litter, so it doesn’t take long to “replace” those lost cubs. It’s also possible that lions might only be killing cubs that would probably die from another source – say, cubs that would otherwise have died from starvation, or cubs that might have been killed by hyenas. Whatever the reason, what we’re seeing is that lions killing cheetah cubs doesn’t have an effect on the total number of cheetahs in the area.
I think this might hold true for other animals, not just cheetahs. It’s a bit of a weird concept to wrap your head around – that being killed, which is really bad if you’re that individual cheetah, doesn’t actually matter as much for the larger population – but it’s one that seems to be gaining traction among ecologists who study how different species live together in the natural world. Specifically, ecologists are getting excited about the role that behavior plays in driving population dynamics.
Most scientists have studied this phenomenon in predator-prey systems – say, wolves and elk, or wolf spiders and “leaf bugs”.

Wolf spider. Photo from Wikipedia.org.

“Leaf bug” from the Miridae family. Photo from Wikipedia.org.
What scientists are discovering is that predators can suppress prey populations not by eating lots of prey, but by causing the prey to change their behavior. Unlike many spiders, wolf spiders actively hunt their prey – sometimes lurking in ambush, other times chasing their prey for some distance. To avoid being eaten, leaf bugs may avoid areas where wolf spiders have lots of hiding places from which to stage an ambush, or leaf bugs may avoid entire patches of land that have lots of wolf spiders. If these areas are the same ones that have lots of mirid bug food, then they’ve effectively lost their habitat. Sound familiar?
Back to Africa – what does this mean for wild dogs and cheetahs? Interestingly enough, lions do not displace cheetahs from large areas of the Serengeti. We’ve discovered this in part from historic radio-collar data that was collected simultaneously on both species in the late 1980’s. Below is a map that shows average lion density across the study area. Green indicates areas with higher densities. The black “+” symbols show where cheetah were tracked within the same study area. They are overwhelmingly more likely to be found in areas with lots of lions. This is because that is where the food is – and cheetahs are following their prey, regardless of the risk of encountering a lion. The Snapshot Serengeti data confirm this – cheetahs are way more likely to be caught on cameras inside lion territories.
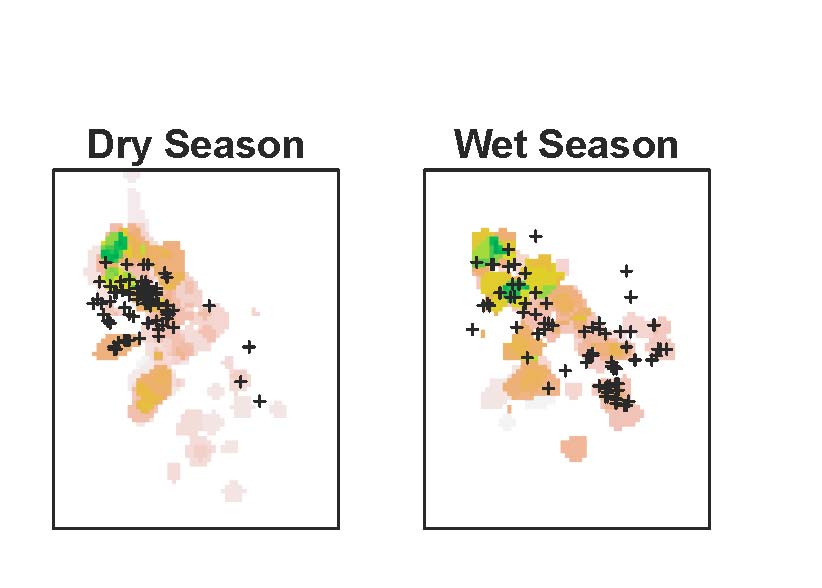
Lion density is mapped per 1km x 1km grid cell. High density areas shown in green, lower in pale orange/gray. Cheetah locations are the black +’s.
Unfortunately, we don’t have radio-collar data on the Serengeti wild dogs from the 1980’s. But we do have radio-collar data for the wild dogs that have been living in the larger Serengeti ecosystem for the past 8 years. As you can see in the map below, wild dogs regularly roam within just 30km of the lion study area. But they don’t settle there – instead, wild dogs remain in hills to the east of Serengeti – where there are local people (who kill wild dogs), but very few lions.

Other researchers in east and southern Africa are starting to pick up on the same patterns in their parks. From Tanzania, to Botswana, to South Africa, researchers are finding that wild dogs get kicked out of really large, prime areas by lions…but that cheetahs do not. What they’re finding (since they have all these animals GPS-collared) is that cheetahs are responding to lions at a very immediate scale. Instead of avoiding habitats that have lions, cheetahs maintain a “safe” distance from the lions – allowing them to use their preferred habitats, but still minimize their risk of getting attacked.
Carnivore researchers are only really just beginning to explore the role of behavior in driving population-level suppression, but I think that there’s good reason to believe that large scale displacement, or other behaviors, for that matter, have greater effects on population numbers of cheetahs and wild dogs, as well as other “subordinate” carnivores – not just in African ecosystems but in systems around the world. It’s a new way of thinking about how competing species all live together in one place, but it’s one that might change the way we approach carnivore conservation for threatened species.
Lions, Cheetahs, and Dogs, Oh My! Part 1.
By now it’s no secret that lions are kind of mean – and that if you are any other carnivore living in the Serengeti, you’d probably prefer a lion-less world. No tawny, muscle-bound foes to steal your food, kill your cubs, chase you around…life would be easy! You’d have plenty of food, your cubs would grow up strong, and your numbers would increase.
Or would they?
It certainly makes sense that all the nasty things that lions do to other carnivores should add up to limit their numbers. Lions are responsible for nearly 30% of wild dog deaths, and over 50% of cheetah deaths! On top of that, they steal food that cheetahs and wild dogs have worked hard to get – and might not have the energy to get again. Researchers are pretty sure that more lions means fewer wild dogs in two ways: 1) In reserves where there are more lions, there are fewer wild dogs, and 2) When lion numbers increase through time, wild dog populations decline.
The same has generally been believed about cheetahs, and some research from the 1990s suggested that reserves with more lions had fewer cheetahs. But as I started digging into the data from Serengeti, I saw a different, quite unexpected, story.
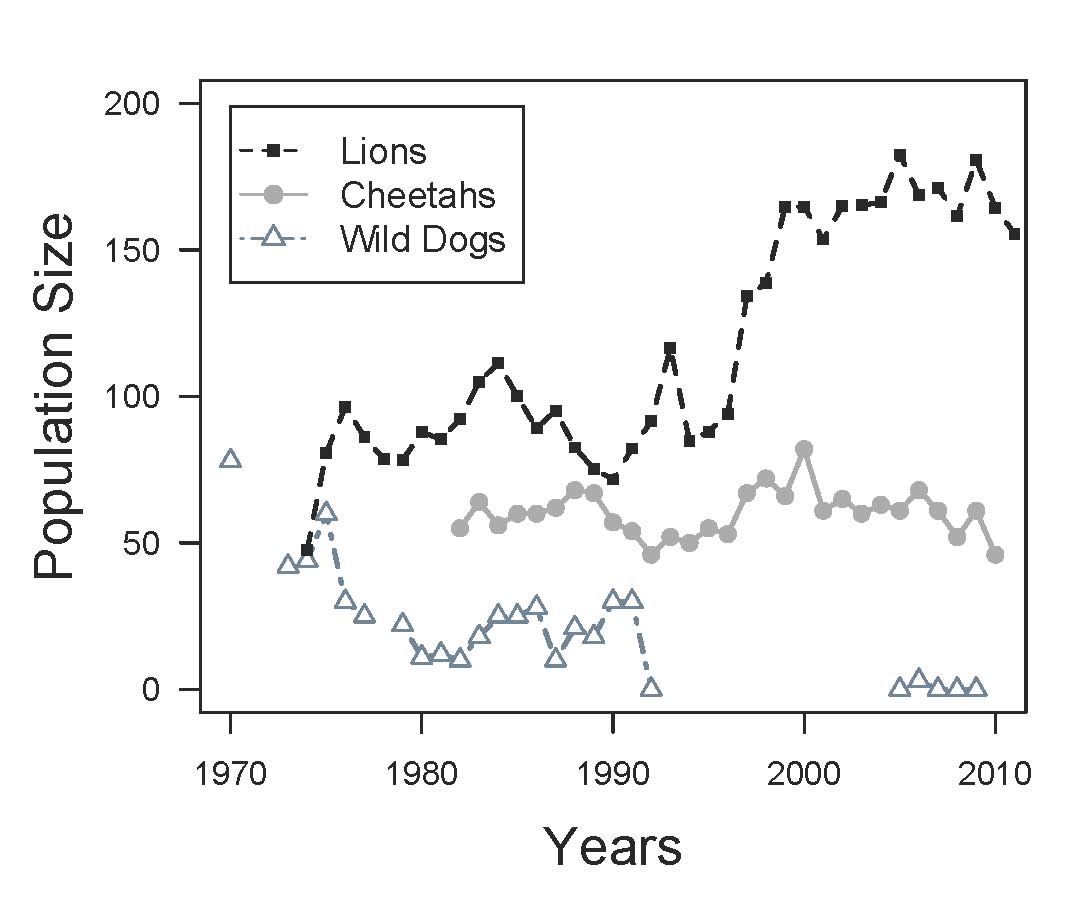
The number of lions, cheetahs, and wild dogs from 1970 onwards. Wild dogs disappeared from the ecosystem from 1992 through 2005.
Lions, cheetahs, and wild dogs were all monitored by long-term projects for a number of years. This graph shows their population sizes since the 1960s. The increase in lions is pretty clear – lions have nearly tripled in the last 40 years, largely due to increases in wildebeest. Wild dogs disappeared from the study area. Now, their final disappearance was due in large part to disease, but it’s possible that lions didn’t help matters. In sharp contrast, the cheetah population has stayed pretty much the same. Sure, there are some ups and downs, but on average, the population has been holding steady over the last 40 years.
Wait a minute, if lions are really bad for cheetahs, then why haven’t cheetah populations declined in the Serengeti? How can they possibly be holding steady when lion numbers have tripled? What is going on???
It’s a good question. Tune in next week for an answer!
