
Happy Mother’s Day!
Yesterday was Mother’s day here in the US and Canada. So in honor of moms of all shapes, sizes, and fur color, here’s a collection of Snapshot Serengeti “family photos.”
Here mom, let me get that for you…

Teenagers. Er, um, pretty much all lions.

Going for a meal…

Wobbly baby eland!

Too cute for words…

Owch.

Oh the cuteness… the cuteness is unbearable.

More results!
As I’m writing up my dissertation (ahh!), I’ve been geeking out with graphs and statistics (and the beloved/hated stats program R). I thought I’d share a cool little tidbit.
Full disclosure: this is just a bit of an expansion on something I posted back in March about how well the camera traps reflect known densities. Basically, as camera traps become more popular, researchers are increasingly looking for simple analytical techniques that can allow them to rapidly process data. Using the raw number of photographs or animals counted is pretty straightforward, but is risky because not all animals are equally “detectable”: some animals behave in ways that make them more likely to be seen than other animals. There are a lot of more complex methods out there to deal with these detectability issues, and they work really well — but they are really complex and take a long time to work out. So there’s a fair amount of ongoing debate about whether or not raw capture rates should ever be used even for quick and dirty rapid assessments of an area.
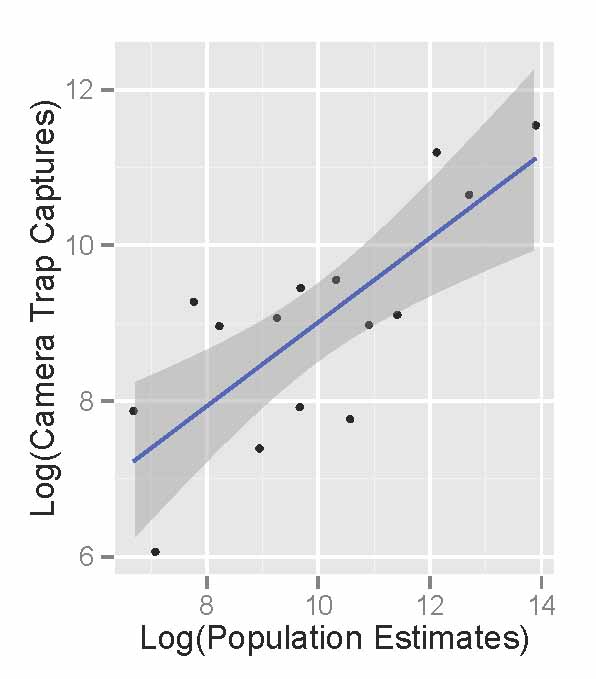
Since the Serengeti has a lot of other long term monitoring, we were able to compare camera trap capture rates (# of photographs weighted by group size) to actual population sizes for 17 different herbivores. Now, it’s not perfect — the “known” population sizes reflect herbivore numbers in the whole park, and we only cover a small fraction of the park. But from the graph below, you’ll see we did pretty well.

Actual herbivore densities (as estimated from long-term monitoring) are given on the x-axis, and the # photographic captures from our camera survey are on the y-axis. Each species is in a different color (migratory animals are in gray-scale). Some of the species had multiple population estimates produced from different monitoring projects — those are represented by all the smaller dots, and connected by a line for each species. We took the average population estimate for each species (bigger dots).
We see a very strong positive relationship between our photos and actual population sizes: we get more photos for species that are more abundant. Which is good! Really good! The dashed line shows the relationship between our capture rates and actual densities for all species. We wanted to make sure, however, that this relationship wasn’t totally dependent on the huge influx of wildebeest and zebra and gazelle — so we ran the same analysis without them. The black line shows that relationship. It’s still there, it’s still strong, and it’s still statistically significant.
Now, the relationship isn’t perfect. Some species fall above the line, and some below the line. For example, reedbuck and topi fall below the line – meaning that given how many topi really live in Serengeti, we should have gotten more pictures. This might be because topi mostly live in the northern and western parts of Serengeti, so we’re just capturing the edge of their range. And reedbuck? This might be a detectability issue — they tend to hide in thickets and so might not pass in front of cameras as often as animals that wander a little more actively.
Ultimately, however, we see that the cameras do a good overall job of catching more photos of more abundant species. Even though it’s not perfect, it seems that raw capture rates give us a pretty good quick look at a system.
Lions and cheetahs and dogs, oh my! (final installment)
I’ve written a handful of posts (here and here and here) about how lions are big and mean and nasty…and about how even though they are nasty enough to keep wild dog populations in check, they don’t seem to be suppressing cheetah numbers.
Well, now that research is officially out! It’s just been accepted by the Journal of Animal Ecology and is available here. Virginia Morrell over at ScienceNews did a nice summary of the story and it’s conservation implications here.
One dissertation chapter down, just two more to go!
South Africa, here I come.
Back in October, I wrote about how a grant proposal was turning me into a zombie.
Well, much to my surprise, turns out that my foray into the world of the walking dead was worth the effort. I’ve just heard that the National Science Foundation does, indeed, want to send me to South Africa to carry out this research!
Basically, I’m interested in how the other big carnivores (hyenas, leopards, cheetahs, and wild dogs) manage to live with lions. And I think that one of the keys to their coexistence has to do with how the other carnivores distribute themselves across the landscape to avoid being killed or harassed by lions. Do they avoid huge tracts of land and lose access to the valuable resources within? Or are they able to fine-tune their behavior and still use those areas without getting into trouble?
As you know, I’m using the camera traps to try and figure out these patterns of habitat use by the major carnivores. But that still just tells me what they do in a place (the Serengeti) where there are lions, and I don’t know if the lions are directly causing these patterns. I can’t, for obvious reasons, do an experiment where I take out all the lions and see if the rest of the animals change their behaviors, which would help me identify such a causal relationship.
But in South Africa, there are two virtually identical reserves — they have the same habitat, the same prey animals, and the same carnivores…except that one has lions and one does not. These reserves are right next to each other and surrounded by fencing. So they are pretty much the perfect experimental system where I can actually answer whether or not the patterns we see in predator behavior are caused by lions. What’s even better is that there are already ongoing research projects there that are running camera trap surveys very similar to Snapshot Serengeti. So most of my work will be doing some measurements of the vegetation and working with the researchers in South Africa to compile their data in a way that we can draw these comparisons.

Comparison of Serengeti (left) and Phinda/Mkhuze (right). Phinda and Mkhuze are two virtually identical reserves in South Africa, except that lions have historically been excluded from Mkhuze.
It’s going to be a *lot* of computer work with a *little* bit of getting out into the bush, but the questions are so cool and the ability to effectively isolate the effect of a single top predator (lions) in a natural ecosystem is so rare, that I couldn’t be more excited about it.
The legend of wolves and wapiti
The story of how reintroduced wolves transformed Yellowstone is now well known. According to the story, wolves scared elk away from the riversides, which allowed the willows and aspen to recover, allowing beavers to come back because they had home-building material big enough to use, and the beaver dams restored the health of the watershed.
I remember reading this story in college. I was sitting at a computer in UVA’s Alderman Library, digging up articles for a class presentation, when I stumbled on the now highly controversial article, “Wolves and the Ecology of Fear.” It blew my mind: right then and there, at the beginning of my last year of college, I knew I wanted to study how predators drove ecosystem dynamics.
It’s a beautiful story, and one that changed the trajectory of my career. And it’s one that’s been very hard to let go of, despite mounting evidence over the last decade that this story might not be more than a myth.
Dr. Arthur Middleton a post-doc at Yale and former graduate student at UWyoming, recently penned a fantastic op-ed about this in the NYtimes.
I had the good fortune of meeting Arthur at the Ecological Society of America talk last summer. I was a big fan of the work that he’d done, and that of his Ph.D. advisor, Dr. Matt Kaufman. But I didn’t envy either of them as they stepped into the fire of trying to take down what has become a beloved, monumental, epic tale. There’s no doubt that behaviorally-mediated trophic cascades do exist, and that predators can have profound influences on ecosystems, but the long-standing poster child for this simply isn’t real.
If you do one thing on your coffee break today, read his piece. While I could summarize the debate here, I couldn’t begin to do justice to Arthur’s eloquent argument.
Scratch that. If there’s one thing you do today, read Arthur’s piece. Not only will it make you think about wolves and ecology, but it will make you think about what nature we save, why we save it, and why that matters.
Season 7
It’s been a long time coming, but it’s really and truly here.
First, we have to reiterate that Season 7 would never have been possible without your help. Last summer, our long-term National Science Foundation funding ran out and we were facing a gap in funding that could have closed down the camera survey forever. We launched the Save Snapshot Serengeti campaign to make sure that Season 7 happened — and because of your support, it did. Thank you, again, for making this project possible in so many ways.
And now! The hard won photos of Season 7 are here.
Season 7 is a big one, running from May 2013 all the way through to the end of November. That’s 7 months! In that time, the long rains faded and the roads became dusty. Stan, whose face you’ve seen so many times checking cams

Stan
began a master’s program in Dar es Salaam, and Norbert took over checking the cameras in his place.

Norbert!
Back in Minnesota, Margaret defended her dissertation and began a new post doc at Harvard working with the Phenocam project. I’ve been frantically analyzing data from Seasons 1-6 to finish my dissertation. And Meredith became the newest member of the Snapshot Serengeti team.
So, stop whatever you’re doing for a few minutes and go check out Season 7. Because really, whose day *isn’t* brightened by photos like this?

Teehee…warthog nose!
Just for fun
Watching animals in the wild, I’m always amazed at their power, agility, stealth, grace…I could go on. Even our household pets seem way more adept at maneuvering in this world than I feel on a daily basis.
And so this site
http://animalssuckingatjumping.tumblr.com/
makes me giggle because it reminds me that I am not the only one who sometimes has trouble making her feet land where they are supposed to. Although I have to admit that if I ever tried to leap upwards ~10x my height, it would end far less gracefully than for these four-legged acrobats, who always seem to walk away completely unscathed.
Happy Monday!
What we’ve seen so far, Part IV
Last week I wrote about using really simple approaches to interpret camera trap data. Doing so makes the cameras a really powerful tool that virtually any research team around the world can use to quickly survey an ecosystem.
Existing monitoring projects in Serengeti give us a really rare opportunity to actually validate our results from Snapshot Serengeti: we can compare what we’re seeing in the cameras to what we see, say, from radio-tracking collared lions, or to the number of buffalo and elephants counted during routine flight surveys.
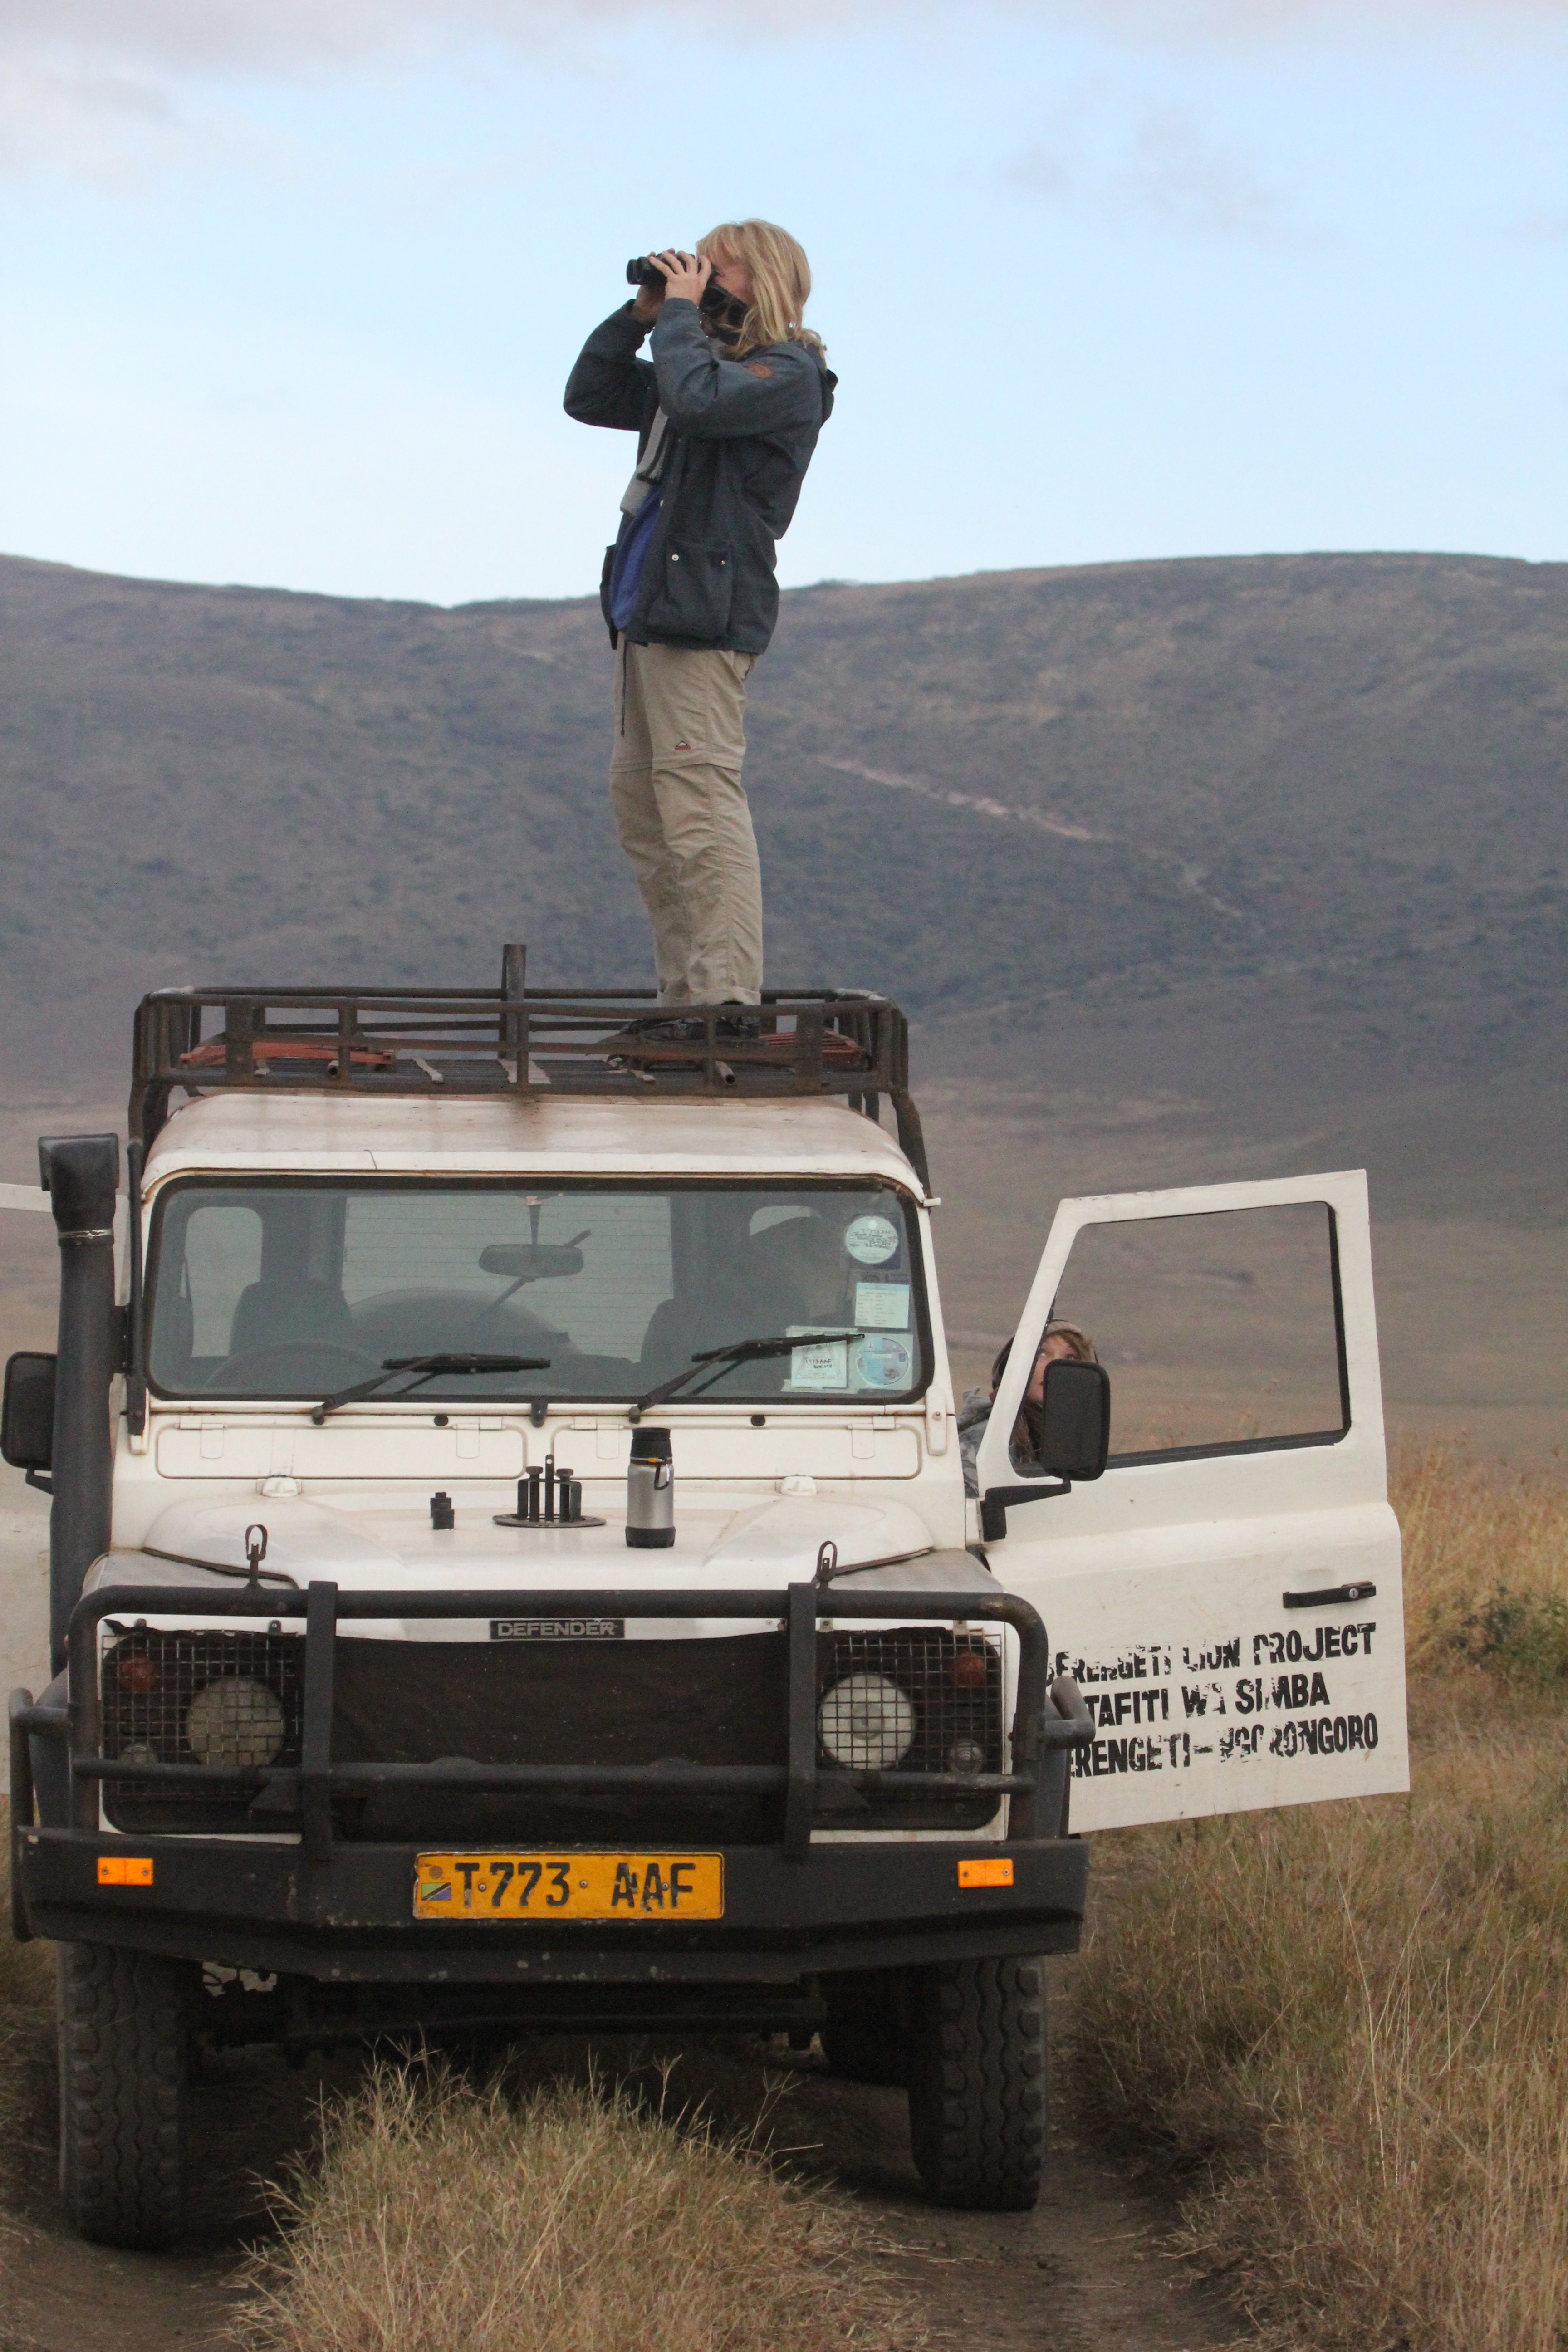
Ingela scanning for lions from the roof of the car.
One of the things we’ve been hoping to do with the cameras is to use them to understand where species are, and how those distributions change. As you know, I’ve struggled a bit with matching lion photographs to known lion ranging patterns. Lions like shade, and because of that, they are drawn to camera traps on lone, shady trees on the plains from miles and miles away.
But I’ve finally been able to compare camera trap captures to know distributions for other animals. Well, one other animal: giraffes. From 2008-2010, another UMN graduate student, Megan Strauss, studied Serengeti giraffes and recorded where they were. By comparing her data with camera trap data, we can see that the cameras do okay.
The graph below compares camera trap captures to known densities of giraffes and lions. Each circle represents a camera trap; the bigger the circle, the more photos of giraffes (top row) or lions (bottom row). The background colors reflect known relative densities measured from long-term monitoring: green means more giraffes or lions; tan/white means fewer. For giraffes, on the whole, we get more giraffe photos in places that have more giraffes. That’s a good sign. The scatterplot visualizes the map in a different way, showing the number of photos on the y-axis vs. the known relative densities on the x-axis.

What we see is that cameras work okay for giraffes, but not so much for lions. Again, I suspect that this has a lot to do with the fact that lions are incredibly heat stressed, and actively seek out shade (which they then sleep in for 20 hours!). But lions are pretty unique in their extreme need for shade, so cameras probably work better for most other species. We see the cameras working better for giraffes, which is a good sign.
We’ve got plans to explore this further. In fact, Season 7 will overlap with a wildebeest study that put GPS collars on a whole bunch of migratory wildebeest. For the first time, we’ll be able to compare really fine scale data on the wildebeest movements to the camera trap photos, and we can test even more precisely just how well the cameras work for tracking large-scale animal movements. Exciting!
What we’ve seen so far, Part III
Over the last few weeks, I’ve shared some of our preliminary findings from Seasons 1-6 here and here. As we’re still wrapping up the final stages of preparation for Season 7, I thought I’d continue in that vein.
One of the coolest things about camera traps is our ability to simultaneously monitor many different animal species all at once. This is a big deal. If we want to protect the world around us, we need to understand how it works. But the world is incredibly complex, and the dynamics of natural systems are driven by many different species interacting with many others. And since some of these critters roam for hundreds or thousands of miles, studying them is really hard.
I have for a while now been really excited about the ability of camera traps to help scientists study all of these different species all at once. But cameras are tricky, because turning those photographs into actual data on species isn’t always straightforward. Some species, for example, seem to really like cameras,

so we see them more often than we really should — meaning we might think there are more of that critter than there really are. There are statistical approaches to deal with this kind of bias in the photos, but these statistics are really complex and time consuming.
This has actually sparked a bit of a debate among researchers who use camera traps. Researchers and conservationists have begun to advocate camera traps as a cost-effective, efficient, and accessible way to quickly survey many understudied, threatened ecosystems around the world. They argue that basic counting of photographs of different species is okay as a first pass to understand what animals are there and how many of them there are. And that requiring the use of the really complex stats might hinder our ability to quickly survey threatened ecosystems.
So, what do we do? Are these simple counts of photographs actually any good? Or do we need to spend months turning them into more accurate numbers?
Snapshot Serengeti is really lucky in that many animals have been studied in Serengeti over the years. Meaning that unlike many camera trap surveys, we can actually check our data against a big pile of existing knowledge. In doing so, we can figure out what sorts of things cameras are good at and what they’re not.
Comparing the raw photographic capture rates of major Serengeti herbivores to their population sizes as estimated in the early 2000’s, we see that the cameras do an okay job of reflecting the relative abundance of different species. The scatterplot below shows the population sizes of 14 major herbivores estimated from Serengeti monitoring projects on the x-axis, and camera trap photograph rates of those herbivores on the y-axis. (We take the logarithm of the value for statistical reasons.) There are really more wildebeest than zebra than buffalo than eland, and we see these patterns in the number of photographs taken.
Like we saw the other week, monthly captures shows that we can get a decent sense of how these relative abundances change through time.

So, by comparing the camera trash photos to known data, we see that they do a pretty good job of sketching out some basics about the animals. But the relationship also isn’t perfect.
So, in the end, I think that our Snapshot Serengeti data suggests that cameras are a fantastic tool and that raw photographic capture rates can be used to quickly develop a rough understanding of new places, especially when researchers need to move quickly. But to actually produce specific numbers, say, how many buffalo per square-km there are, we need to dive in to the more complicated statistics. And that’s okay.
Find that nest!
You’ve got to check out this game: http://nightjar.exeter.ac.uk/story/nightjar_game

Scientists from the University of Exeter are trying to understand camouflage. Specifically, they want to understand how camouflage helps protect animals from being eaten for dinner, and they’re doing this by studying ground nesting birds in South Africa & Zambia.
Like Snapshot Serengeti, these guys use camera traps too, to figure out whose munching on birds and their nests. Unlike Snapshot Serengeti, however, they aren’t asking for help IDing the photos: instead, they’re asking for help figuring out how predators see, and how different types of camouflage work better or worse against predators with different types of vision.
Humans have trichromatic vision, meaning we have three different types of receptors (light sensitive cells in the eye) that can process color: red (longwave), green (mediumwave), and blue (shortwave). Some animals only have two receptor types and can only see one or two colors, whereas other animals have four, allowing them to see wavelengths such as infrared or ultraviolet that are invisible to people. Thus, what camouflages eggs against one predator might not work so well against another predator.
What these researchers have done is create a game that mimics the vision of other predators. So you get to see the world through the eyes of either a genet cat (with dichromatic vision) or a vervet monkey (with trichromatic vision), and “hunt” for birds or their nests in a series of pictures. This helps scientists understand how perception changes among different animals, and how camouflage works against different perception types.
So go check it out! But don’t forget to come back and then help us classify Season 7! We’ll announce its debut on the blog soon!
