
Monday.
Apparently I am no longer invincible. I hear this is what happens when you turn 30 (next week!) but I didn’t believe it. Nonetheless, reality cares not for what I do and don’t believe, and my backcountry vacation in the Yellowstone and Tetons (with bears! and marmots! and moose!) left me with a cold that has knocked me flat on my back.
So, instead of trying to blog, in between bites of chicken & stars soup and through the fog on NyQuil, about why shade skews our perception of where animals are hanging out, I am instead suggesting you read this gorgeous blog post by one of the students with the Masaai Mara Hyena Project. Masaai Mara is part of the larger Serengeti-Mara ecosystem, which spans Kenya and Tanzania. Masaai Mara falls on the Kenyan side of the border, and Serengeti on the Tanzanian side.
The hyena project is overseen by Kay Holekamp’s lab at the University of Michigan. I had the privilege of spending a week or so with these guys in the Mara in 2012, trying to fool their hyenas with our lifesized lion dummies. They are an amazing, fun, and productive group doing really cool research about the intersection of hyena physiology and behavior. It’s sort of the flip side of what I’m interested in – whereas I’m interested in how animal behaviors translate upwards into larger scale dynamics of populations, Holekamp’s group is trying to understand the physiological drivers of, and implications of, these behaviors. For example, hyenas live in incredibly hierarchical societies. What makes a hyena “top dog”, if you will, in a clan? And in turn, how does that dominance status affect that individual’s health? Their reproduction? Why do lower-ranking individuals help higher ranking individuals acquire food, when they don’t actually get to eat it? Stuff like that. It’s pretty cool. So check them out!
We (or at least the lions) miss the migration
Hi everyone —
It’s Friday and we’re short a guest post! Since I’ve just returned from a backcountry holiday in Yellowstone, and Margaret is at a scientific conference, I thought I’d fill this space with a quick video of last year’s migration. I recruited Jason Adams, a Serengeti-based hot-air balloon pilot (and Canada’s reigning hot-air ballooning champion), to help me capture the scene on his Go-Pro.
Cute Baby Elephant
I hope you’ve been having fun with the new Season 5 images. I have. It’s been about a week since we went live with Season 5, and we’re making good progress. It took under two weeks to go through the first three seasons in December. (We had some media attention then and lots of people checking out the site.) It took about three weeks to finish Season 4 in January. According to my super science-y image copy-and-paste method, it may take us about two months to do Season 5:
 And that’s fine. But I was curious about who’s working on Season 5. The Talk discussion boards are particularly quiet, with almost no newbie questions. So is everyone working on Season 5 a returnee? Or do we have new folks on board?
I looked at the user data from a data dump done on Sunday. So it includes the first 5 or so days of Season 5. In total, there are 2,000 volunteers who had contributed to 280,000 classifications by Sunday! I was actually quite amazed to see that 6% of the classifications are being done by folks not logged in. Is that because they’re new people trying out the site — or because there are some folks who like to classify without logging in? I can’t tell.
But I can compare Season 5 to Season 4. We had 8,300 logged-in volunteers working on Season 4. Of all the classifications, 9% were done by not-logged-in folks. That suggests we have fewer newcomers so far for Season 5. But then we get to an intriguing statistic: of those 2,000 volunteers working on Season 5 in its first five days, 33% of them did not work on Season 4 at all! And those 33% apparently new folks have contributed 50% of the (logged-in) classifications!
So what’s going on? Maybe we’re getting these new volunteers from other Zooniverse projects that have launched since January. Maybe they’re finding us in other ways. (Have you seen that the site can be displayed in Finnish in addition to Polish now?) But in any case, welcome everyone and I hope you spot your favorite animal.
Me, I found this super cute baby elephant just the other day:

Space and time
If you are a nerd like me, the sheer magnitude of questions that can be addressed with Snapshot Serengeti data is pretty much the coolest thing in the world. Though, admittedly, the jucy lucy is a close second.
The problem with these really cool questions, however, is that they take some rather complicated analyses to answer. And there are a lot of steps along the way. For example, ultimately we hope to understand things like how predator species coexist, how the migration affects resident herbivores, and how complex patterns of predator territoriality coupled with migratory and resident prey drive the stability of the ecosystem… But we first have to be able to turn these snapshots into real information about where different animals are and when they’re there.
That might sound easy. You guys have already done the work of telling us which species are in each picture – and, as Margaret’s data validation analysis shows, you guys are really good at that. So, since we have date, time, and GPS information for each picture, it should be pretty easy to use that, right?
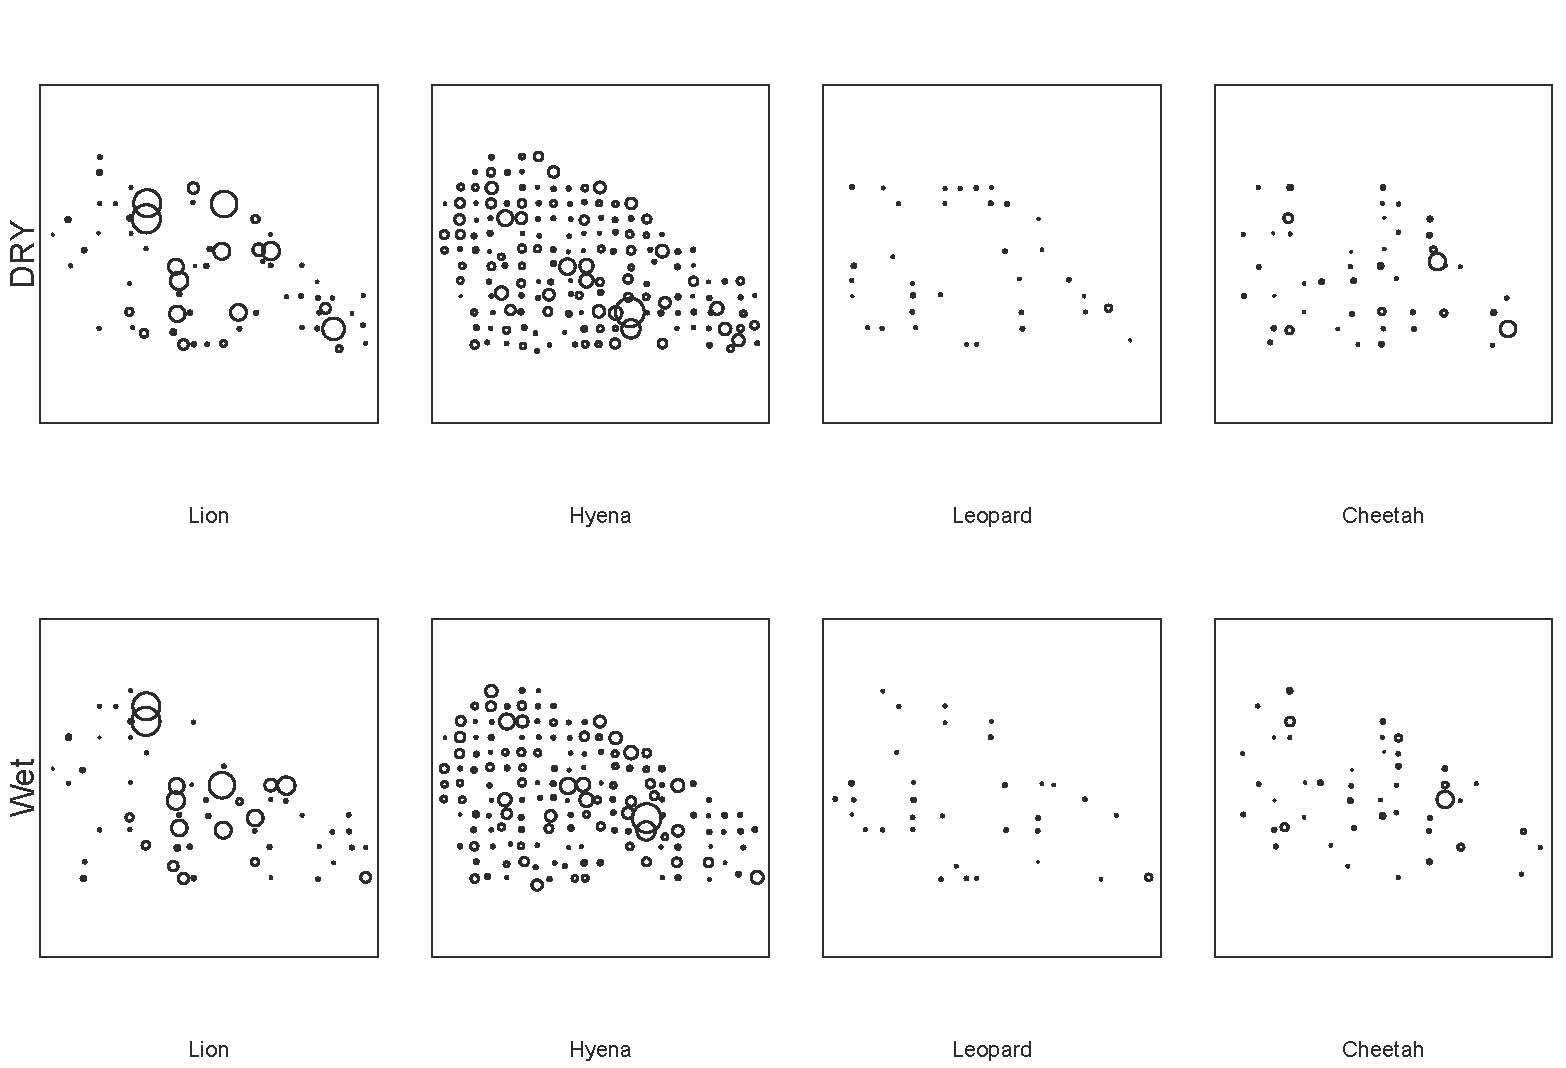
Sort of. On one hand, it’s really easy to create preliminary maps from the raw data. For example, this map shows all the sightings of lions, hyenas, leopards, and cheetahs in the wet and dry seasons. Larger circles mean that more animals were seen there; blank spaces mean that none were.
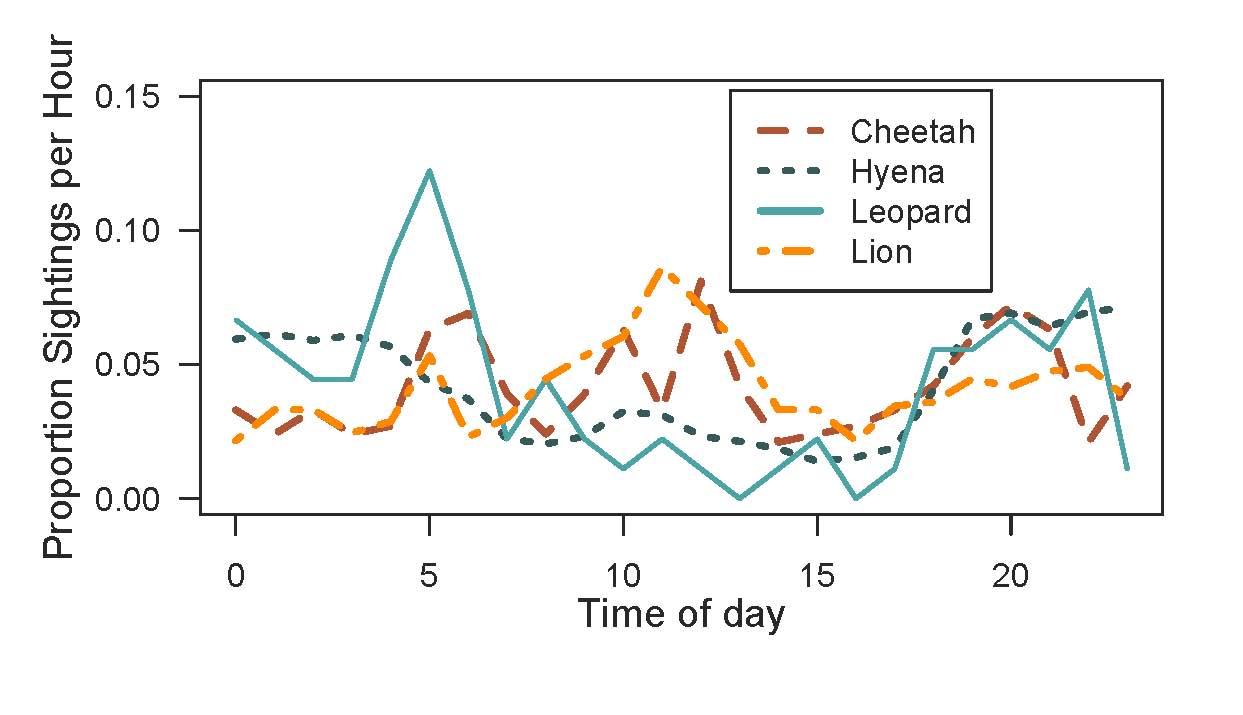
And it’s pretty easy to map when we’re seeing animals. This graph shows the number of sightings for each hour of the day. On the X-axis, 0 is midnight, 12 is noon, 23 is 11pm.
So we’ve got a good start. But then the question becomes “How well do the cameras reflect actual activity patterns?” And, more importantly, “How do we interpret the camera trap data to understand actual activity patterns?”
For example, take the activity chart above. Let’s look at lions. We know from years and years of watching lions, day and night, that they are a lot more active at night. They hunt, they fight, they play much more at night than during the day. But when we look at this graph, we see a huge number of lion photos taken between hours 10:00 to 12:00. If we didn’t know anything about lions, we might think that lions were really active during that time, when in reality, they’ve simply moved 15 meters over to the nearest tree for shade, and then stayed there. Because we have outside understanding of how these animals move, we’re able to identify sources of bias in the camera trapping data, and account for them so we can get to the answers we’re really looking for.
So far, shade seems to be our biggest obstacle in reconciling how the cameras see the world vs. what is actually going on. I’ve just shown you a bit about how shade affects camera data on when animals are active – next week I’ll talk more about how it affects camera data on where animals are.

Hard to find a better place to nap…
Plurality algorithm
On Wednesday, I wrote about how well the simple algorithm I came up with does against the experts. The algorithm looks for species that have more than 50% of the votes in a given capture (i.e. species that have a majority). Commenter Tor suggested that I try looking at which species have the most votes, regardless of whether they cross the 50% mark (i.e. a plurality). It’s a great idea, and easy to implement because any species that has more than 50% of the vote ALSO has the plurality. Which means all I have to do is look at the handful of captures that the majority algorithm had no answer for.
You can see why it might be a good idea in this example. Say that for a particular capture, you had these votes:
| 10 | impala |
| 4 | gazelleThomsons |
| 4 | dikDik |
| 3 | bushbuck |
You’d have 21 votes total, but the leading candidate, impala, would be just shy of the 11 needed to have a majority. It really does seem like impala is the likely candidate here, but my majority algorithm would come up with “no answer” for this capture.
So I tried out Tor’s plurality algorithm. The good news is that 57% of those “no answers” got the correct answer with the plurality algorithm. So that brings our correct percentage from 95.8% to 96.6%. Not bad! Here’s how that other 3.4% shakes out:
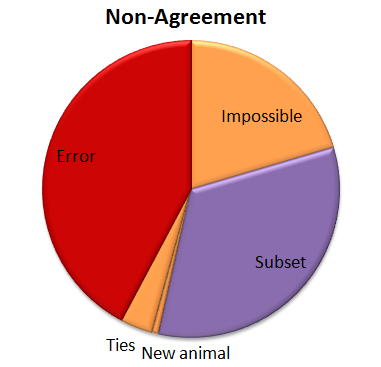
So now we have a few more errors. (About a quarter of the “no answers” were errors when the plurality algorithm was applied.) And we’ve got a new category called “Ties”. When you look for a plurality that isn’t over 50%, there can be ties. And there were. Five of them. And in every case the right answer was one of the two that tied.
And now, because it’s Friday, a few images I’ve stumbled upon so far in Season 5. What will you find?


Algorithm vs. Experts
Recently, I’ve been analyzing how good our simple algorithm is for turning volunteer classifications into authoritative species identifications. I’ve written about this algorithm before. Basically, it counts up how many “votes” each species got for every capture event (set of images). Then, species that get more than 50% of the votes are considered the “right” species.
To test how well this algorithm fares against expert classifiers (i.e. people who we know to be very good at correctly identifying animals), I asked a handful of volunteers to classify several thousand randomly selected captures from Season 4. I stopped everyone as soon as I knew 4,000 captures had been looked at, and we ended up with 4,149 captures. I asked the experts to note any captures that they thought were particularly tricky, and I sent these on to Ali for a final classification.
Then I ran the simple algorithm on those same 4,149 captures and compared the experts’ species identifications with the algorithm’s identifications. Here’s what I found:
 For a whopping 95.8% of the captures, the simple algorithm (due to the great classifying of all the volunteers!) agrees with the experts. But, I wondered, what’s going on with that other 4.2%. So I had a look:
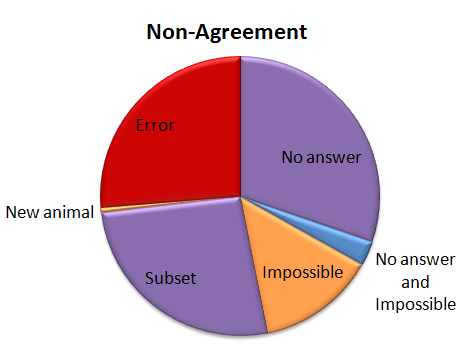 Of the captures that didn’t agree, about 30% were due to the algorithm coming up with no answer, but the experts did. This is “No answer” in the pie chart. The algorithm fails to come up with an answer when the classifications vary so much that there is no single species (or combination if there are multiple species in a capture) that takes more than 50% of the vote. These are probably rather difficult images, though I haven’t looked at them yet.
Another small group — about 15% of captures was marked as “impossible” by the experts. (This was just 24 captures out of the 4,149.) And five captures were both marked as “impossible” and the algorithm failed to come up with an answer; so in some strange way, we might consider these five captures to be in agreement.
Just over a quarter of the captures didn’t agree because either the experts or the algorithm saw an extra species in a capture. This is labeled as “Subset” in the pie chart. Most of the extra animals were Other Birds or zebras in primarily wildebeest captures or wildebeest in primarily zebra captures. The extra species really is there, it was just missed by the other party. For most of these, it’s the experts who see the extra species.
Then we have our awesome, but difficulty-causing duiker. There was no way for the algorithm to match the experts because we didn’t have “duiker” on the list of animals that volunteers could choose from. I’ve labeled this duiker as “New animal” on the pie chart.
Then the rest of the captures — just over a quarter of them — were what I’d call real errors. Grant’s gazelles mistaken for Tommies. Buffalo mistaken for wildebeest. Aardwolves mistaken for striped hyenas. That sort of thing. They account for just 1.1% of all the 4,149 captures.
I’ve given the above Non-agreement pie chart some hideous colors. The regions in purple are what scientists call Type II errors, or “false negatives.” That is, the algorithm is failing to identify a species that we know is there — either because it comes up with no answer, or because it misses extra species in a capture. I’m not too terribly worried about these Type II errors. The “Subset” ones happen mainly with very common animals (like zebra or wildebeest) or animals that we’re not directly studying (like Other Birds), so they won’t affect our analyses. The “No answers” may mean we miss some rare species, but if we’re analyzing common species, it won’t be a problem to be missing a small fraction of them.
The regions in orange are a little more concerning; these are the Type I errors, or “false positives.” These are images that should be discarded from analysis because there is no useful information in them for the research we want to do. But our algorithm identifies a species in the images anyway. These may be some of the hardest captures to deal with as we work on our algorithm.
And the red-colored errors are obviously a concern, too. The next step is to incorporate some smarts into our simple algorithm. Information about camera location, time of day, and identification of species in captures immediately before or following a capture can give us additional information to try to get that 4.2% non-agreement even smaller.
Drumroll, please
If you’ve been following Margaret’s blogs, you’ve known this moment was coming. So stop what you’re doing, put down your pens and pencils, and open up your internet browsers, folks, because Season 5 is here!
It’s been an admittedly long wait. Season 5 represents photos from June – December 2012. During those six months I was back here in Minnesota, working with Margaret and the amazing team at Zooniverse to launch Snapshot Serengeti; meanwhile, in Serengeti, Stanslaus Mwampeta was working hard to keep the camera trap survey going. I mailed the Season 5 photos back as soon as possible after returning to Serengeti – but the vagaries of cross-continental postal service were against us, and it took nearly 5 months to get these images from Serengeti to Minnesota, where they could be prepped for the Snapshot interface.
So now that you’ve finally kicked the habit, get ready to dive back in. As with Season 4, the photos in Season 5 have never been seen before. Your eyes are the first. And you might see some really exciting things.
For starters, you won’t see as many wildebeest. By now, they’ve moved back to the north – northern Serengeti as well as Kenya’s Masaai Mara – where more frequent rains keep the grass long and lush year-round. Here, June marks the onslaught of the dry season. From June through October, if not later, everything is covered in a relentless layer of dust. After three months without a drop of rain, we start to wonder if the water in our six 3,000 liter tanks will last us another two months. We ration laundry to one dusty load a week, and showers to every few field days. We’ve always made it through so far, but sometimes barely…and often rather smelly.
You might see Stan

Norbert

And occasionally Daniel

Or me
Checking the camera traps.
But most excitingly, you might see African wild dogs.

photo nabbed from: http://en.wikipedia.org/wiki/File:LycaonPictus.jpg
Also known as the Cape hunting dog or painted hunting dog, these canines disappeared from Serengeti in the early 1990’s. While various factors may have contributed to their decline, wild dog populations have lurked just outside the Serengeti, in multi-use protected areas (e.g. with people, cows, and few lions) for at least 10 years. Many researchers suspect that wild dogs have failed to recolonize their previous home-ranges inside the park because lion populations have nearly tripled – and as you saw in “Big, Mean, & Nasty”, lions do not make living easy for African wild dogs.
Nonetheless, the Tanzanian government has initiated a wild dog relocation program that hopes to bring wild dogs back to Serengeti, where they thrived several decades ago. In August 2012, and again in December, the Serengeti National Park authorities released a total of 29 wild dogs in the western corridor of the park. While the release area is well outside of the camera survey area, rumor has it that the dogs booked it across the park, through the camera survey, on their journey to the hills of Loliondo. Only a handful of people have seen these newly released dogs in person, but it’s possible they’ve been caught on camera. So keep your eyes peeled! And if you see something that might be a wild dog, please tag it with #wild-dog!! Happy hunting!
Living with lions
A few weeks ago, I wrote about how awful lions are to other large carnivores. Basically, lions harass, steal food from, and even kill hyenas, cheetahs, leopards, and wild dogs. Their aggression usually has no visible justification (e.g. they don’t eat the cheetahs they kill), but can have devastating effects. One of my main research goals is to understand how hyenas, leopards, cheetahs, and wild dogs survive with lions. As I mentioned the other week, I think the secret may lie in how these smaller carnivores use the landscape to avoid interacting with lions.
Top predators (the big ones doing the chasing and killing) can create what we call a “landscape of fear” that essentially reduces the amount of land available to smaller predators. Smaller predators are so afraid of encountering the big guys that they avoid using large chunks of the landscape altogether. One of my favorite illustrations of this pattern is the map below, which shows how swift foxes restrict their territories to the no-man’s land between coyote territories.
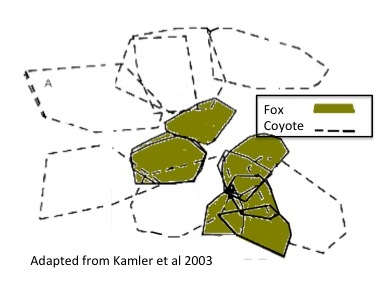
A map of coyote and swift fox territories in Texas. Foxes are so afraid of encountering coyotes that they restrict their territories into the spaces between coyote ranges.
The habitat inside the coyote territories is just as good, if not better, for the foxes, but the risk of encountering a coyote is too great. By restricting their habitat use to the areas outside coyote territories, swift foxes have essentially suffered from habitat loss, meaning that they have less land and fewer resources to support their population. There’s growing evidence that this effective habitat loss may be the mechanism driving suppression in smaller predators. In fact, this habitat loss may have larger consequences on a population than direct killing by the top predator!
While some animals are displaced from large areas, others may be able to avoid top predators at a much finer scale. They may still use the same general areas, but use scent or noise to avoid actually running into a lion (or coyote). This is called fine-scale avoidance, and I think animals that can achieve fine-scale avoidance, instead of suffering from large-scale displacement, manage to coexist.
The camera traps are, fingers crossed, going to help me understand at what scale hyenas, leopards, cheetahs, and wild dogs avoid lions. My general hypothesis is that if these species are generally displaced from lion territories, and suffer effective habitat loss, their populations should decline as lion populations grow. If instead they are able to use the land within lion territories, avoiding lions by shifting their patterns of habitat use or changing the time of day they are active, then I expect them to coexist with lions pretty well.
So what have we seen so far? Stay tuned – I’ll share some preliminary results next week!
#####
Map adapted from: Kamler, J.F., Ballard, W.B., Gilliland, R.L., and Mote, K. (2003b). Spatial relationships between swift foxes and coyotes in northwestern Texas. Canadian Journal of Zoology 81, 168–172.
Update on Season 5
In short, delay. 😦
In long, we’ve processed all the images and are uploading them onto the Zooniverse servers. However, it’s taking a long time. A really long time. Since Season 4, the Minnesota Supercomputer Institute (MSI) has switched over to a new system, and it seems like the upload time from this new system is painfully slow. We’ve uploaded over 25% of the images, but it’s taken a couple days uploading non-stop. So best estimate is mid to late next week for when they’ll all be uploaded. We’re trying to coordinate with the staff at MSI to see if they can increase upload speeds for us, but no guarantees.
(Man, I wish we had some images of turtles or snails or sloths or something from Serengeti… Wait! I know what’s slow — stationary, actually.)

Waiting…
Meanwhile, you can read a guest blog post that I wrote over at Dynamic Ecology. Dynamic Ecology is read by ecologists, so my blog post introduces the concept of citizen science (and Snapshot Serengeti, of course) to professional ecologists who may not be very familiar with it. One question that comes up in the comments is: can you do citizen science if you don’t have cool, awesome animals? Like, what if you have flies or worms or plankton instead? I think the answer is yes. But feel free to give your perspectives in the comments there, too.
Not on the A-List
I’m working on an analysis that compares the classifications of volunteers at Snapshot Serengeti with the classifications of experts for several thousand images from Season 4. This analysis will do two things. First, it will give us an idea of how good (or bad) our simple vote-counting method is for figuring out species in pictures. Second, it will allow us to see if more complicated systems for combining the volunteer data work any better. (Hopefully I’ll have something interesting to say about it next week.)
Right now I’m curating the expert classifications. I’ve allowed the experts to classify an image as “impossible,” which, I know, is totally unfair, since Snapshot Serengeti volunteers don’t get that option. But we all recognize that for some images, it really isn’t possible to figure out what the species is — either because it’s too close or too far or too off the side of the image or too blurry or …. The goal is that whatever our combining method is, it should be able to figure out “impossible” images by combining the non-“impossible” classifications of volunteers. We’ll see if we can do it.
Another challenge that I’m just running into is that our data set of several thousand images contains a duiker. A what? A common duiker, also known as a bush duiker:

Common duiker
You’ve probably noticed that “duiker” is not on the list of animals we provide. While the common duiker is widespread, it’s not commonly seen in the Serengeti, being small and active mainly at night. So we forgot to include it on the list. (Sorry about that.)
The result is that it’s technically impossible for volunteers to properly classify this image. Which means that it’s unlikely that we’ll be able to come up with the correct species identification when we combine volunteer classifications. (Interested in what the votes were for this image? 10 reedbuck, 6 dik dik, and 1 each of bushbuck, wildebeest(!), and impala.)
The duiker is not the only animal that’s popped up unexpectedly since we put together the animal list and launched the site. I never expected we’d catch a bat on film:

Bat
Our friends over at Bat Detective tell us that the glare on the face makes it impossible to truly identify, but they did confirm that it’s a large, insect-eating bat. Anyway, how to classify it? It’s not a bird. It’s not a rodent. And we didn’t allow for an “other” category.
I also didn’t think we’d see insects or spiders.

Spider
Moths fly by, ticks appear on mammal bodies, spiders spin webs in front of the camera and even ants have been seen walking on nearby branches. Again, how should they be classified?
And here’s one more uncommon antelope that we’ve seen:

Steenbok
It’s a steenbok, again not commonly seen in Serengeti. And so we forgot to put it on the list. (Sorry.)
Luckily, all these animals we missed from the list are rare enough in our data that when we analyze thousands of images, the small error in species identification won’t matter much. But it’s good to know that these rarely seen animals are there. When Season 5 comes out (soon!), if you run into anything you think isn’t on our list, please comment in Talk with a hash-tag, so we can make a note of these rarities. Thanks!
