
The trouble with shade
Who knew that shade could be so problematic? A couple of weeks ago, I wrote about how shade seems to be my biggest obstacle in reconciling how the cameras see the world vs. what is actually going on. My job is to figure out how to make things right.
To start with, the camera traps are up on trees. Mostly. As you know, the cameras are on a rough grid layout – 225 grid cells, each 5km2 (2.236km on each side) — covering a total of 1,125 km2 of Serengeti’s center. This kind of design makes sure that we are covering enough of the landscape to capture the bigger picture of animal distributions and movements. Each camera is roughly at the center of each grid cell – on the closes suitable tree to that center point. Some trees are big and shady; some are small and spindly. In the woodlands, there are trees everywhere; on the plains, the camera-trap tree can be the only tree for miles. And sometimes there are no trees at all, and here the cameras get put up on metal poles.


These different habitats are important to capture. I think that animals might behave very differently in areas with lots of trees than they do in areas with very few trees. When it comes to the aggressive interactions between carnivores, for example, trees, shrubs, and tall grass provide great hiding places for the smaller species. It’s like trying to hide from someone you don’t like in an empty room vs. in a really huge, crowded shopping mall.
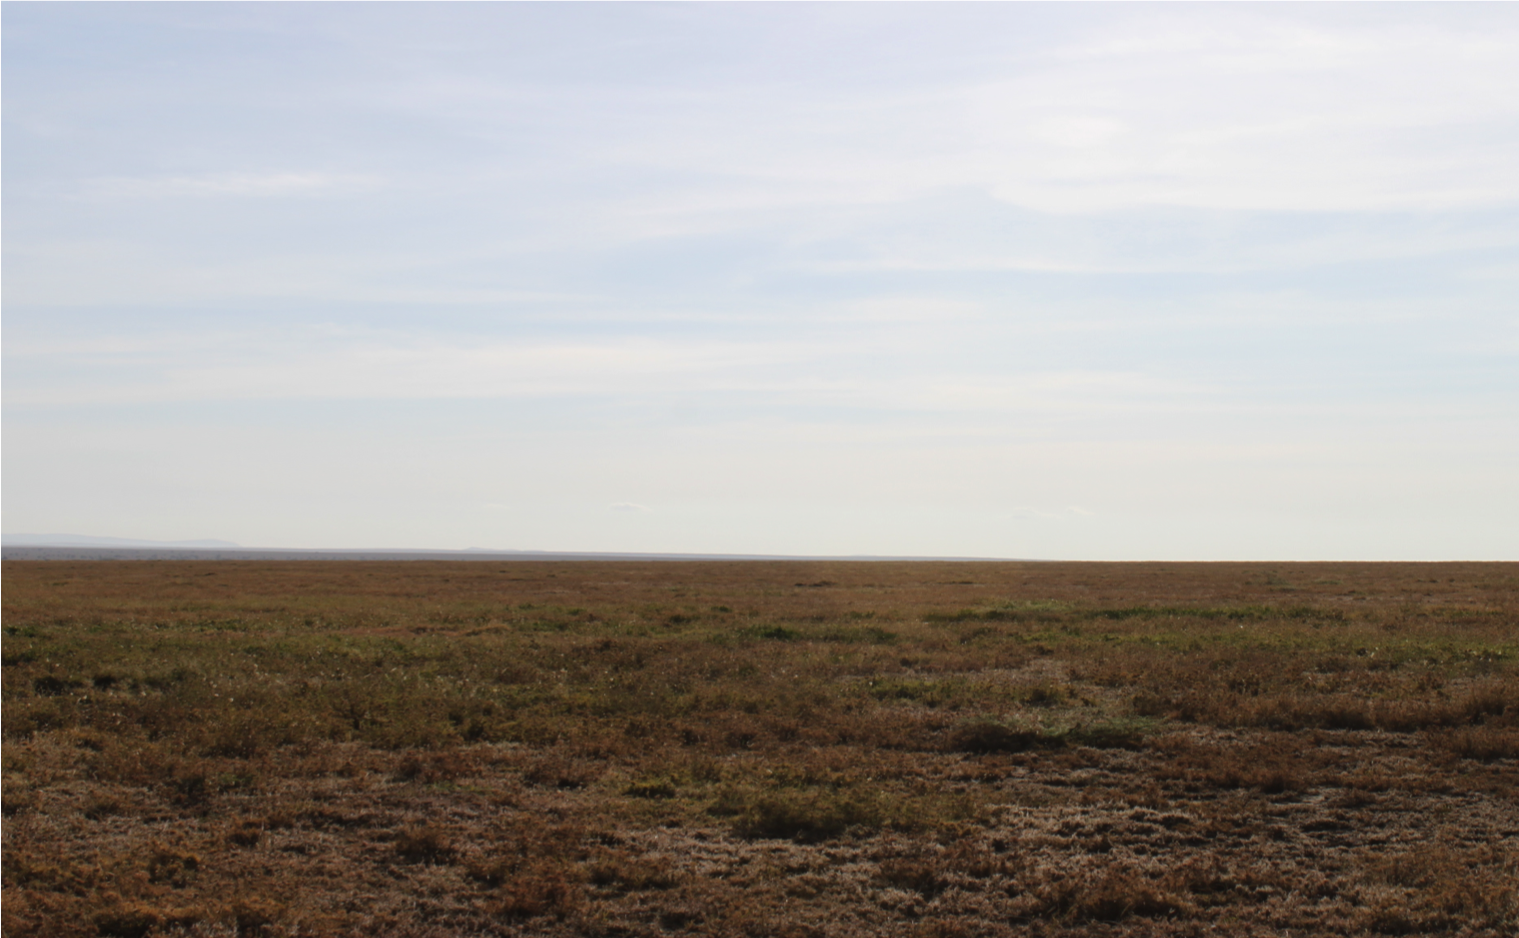
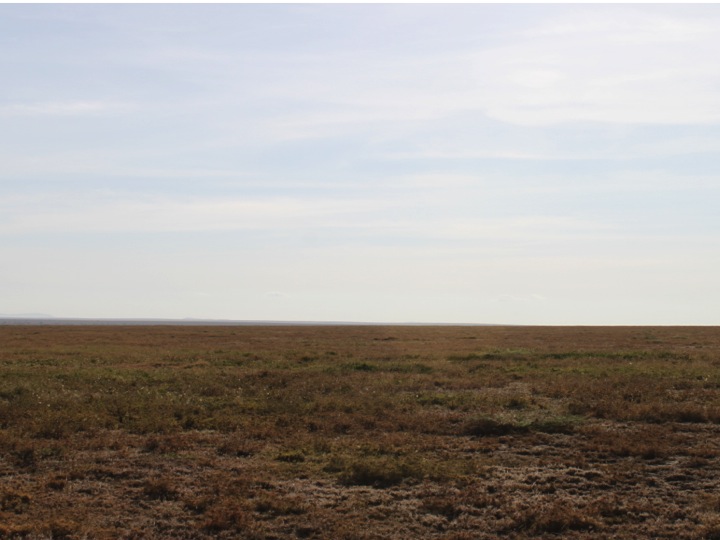
It’s a lot harder to hide from lions here
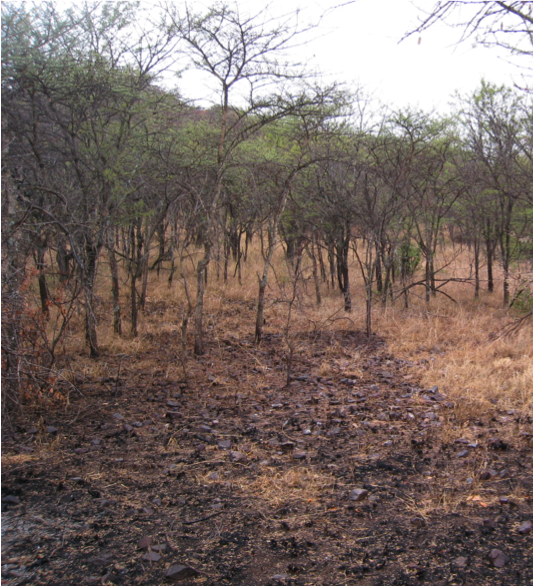
…than here
The problem is that camera traps work better in some habitats than others – at least for certain species. Say you are a huge, muscle-bound lion. Even standing is tiring in the Serengeti heat, and you spend your days breathing heavily even at rest. You like shade. A lot. If you are out in the open plains, a single shade tree will stick out for miles, and you’ll probably work your way to it. Chances are, that tree has a camera. In the woodlands, though, there are lots of trees. And the camera trap could be on any one of them. So even if you’re searching for shade, the chances of you walking past the camera trap in the woodland are far smaller – just because there are so many trees to choose from.
Here’s a map of the study area – green shows more densely wooded areas, whereas yellow marks the plains. Camera traps that have captured lions are shown with circles; the bigger the circle, the more lions were seen at that trap. I know for a fact that there are more lions in the northern half of that map than in the southern half, but the lions out on the plains seem to really like getting their picture taken!
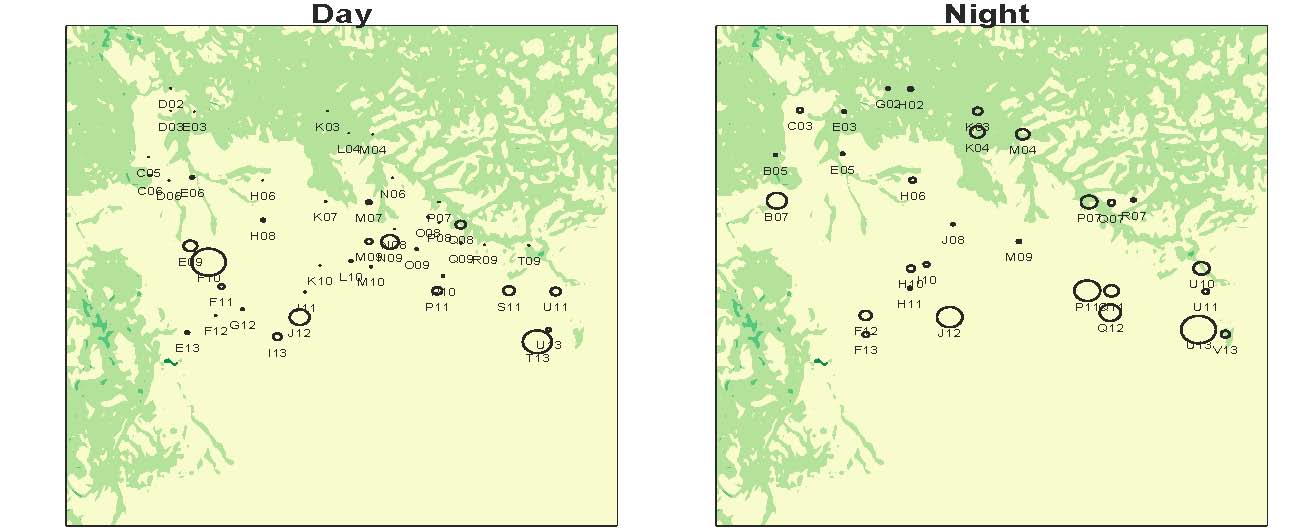
The pattern looks a little better at night than in the day, but it’s not perfect. So perhaps shade isn’t the only thing affecting how these cameras “see” lions in different habitats.
As depressing as this problem seems at first glance, I’m optimistic that we can solve it (enter Kibumbu’s new GPS collar!), but those methods are material for another day. In the meanwhile, what else do you think might be going on that attracts lions, or other animals to trees, besides shade?
Plurality algorithm
On Wednesday, I wrote about how well the simple algorithm I came up with does against the experts. The algorithm looks for species that have more than 50% of the votes in a given capture (i.e. species that have a majority). Commenter Tor suggested that I try looking at which species have the most votes, regardless of whether they cross the 50% mark (i.e. a plurality). It’s a great idea, and easy to implement because any species that has more than 50% of the vote ALSO has the plurality. Which means all I have to do is look at the handful of captures that the majority algorithm had no answer for.
You can see why it might be a good idea in this example. Say that for a particular capture, you had these votes:
| 10 | impala |
| 4 | gazelleThomsons |
| 4 | dikDik |
| 3 | bushbuck |
You’d have 21 votes total, but the leading candidate, impala, would be just shy of the 11 needed to have a majority. It really does seem like impala is the likely candidate here, but my majority algorithm would come up with “no answer” for this capture.
So I tried out Tor’s plurality algorithm. The good news is that 57% of those “no answers” got the correct answer with the plurality algorithm. So that brings our correct percentage from 95.8% to 96.6%. Not bad! Here’s how that other 3.4% shakes out:
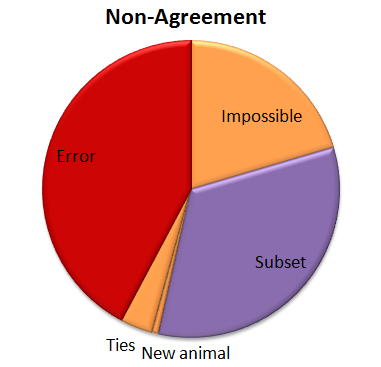
So now we have a few more errors. (About a quarter of the “no answers” were errors when the plurality algorithm was applied.) And we’ve got a new category called “Ties”. When you look for a plurality that isn’t over 50%, there can be ties. And there were. Five of them. And in every case the right answer was one of the two that tied.
And now, because it’s Friday, a few images I’ve stumbled upon so far in Season 5. What will you find?


Algorithm vs. Experts
Recently, I’ve been analyzing how good our simple algorithm is for turning volunteer classifications into authoritative species identifications. I’ve written about this algorithm before. Basically, it counts up how many “votes” each species got for every capture event (set of images). Then, species that get more than 50% of the votes are considered the “right” species.
To test how well this algorithm fares against expert classifiers (i.e. people who we know to be very good at correctly identifying animals), I asked a handful of volunteers to classify several thousand randomly selected captures from Season 4. I stopped everyone as soon as I knew 4,000 captures had been looked at, and we ended up with 4,149 captures. I asked the experts to note any captures that they thought were particularly tricky, and I sent these on to Ali for a final classification.
Then I ran the simple algorithm on those same 4,149 captures and compared the experts’ species identifications with the algorithm’s identifications. Here’s what I found:
 For a whopping 95.8% of the captures, the simple algorithm (due to the great classifying of all the volunteers!) agrees with the experts. But, I wondered, what’s going on with that other 4.2%. So I had a look:
 Of the captures that didn’t agree, about 30% were due to the algorithm coming up with no answer, but the experts did. This is “No answer” in the pie chart. The algorithm fails to come up with an answer when the classifications vary so much that there is no single species (or combination if there are multiple species in a capture) that takes more than 50% of the vote. These are probably rather difficult images, though I haven’t looked at them yet.
Another small group — about 15% of captures was marked as “impossible” by the experts. (This was just 24 captures out of the 4,149.) And five captures were both marked as “impossible” and the algorithm failed to come up with an answer; so in some strange way, we might consider these five captures to be in agreement.
Just over a quarter of the captures didn’t agree because either the experts or the algorithm saw an extra species in a capture. This is labeled as “Subset” in the pie chart. Most of the extra animals were Other Birds or zebras in primarily wildebeest captures or wildebeest in primarily zebra captures. The extra species really is there, it was just missed by the other party. For most of these, it’s the experts who see the extra species.
Then we have our awesome, but difficulty-causing duiker. There was no way for the algorithm to match the experts because we didn’t have “duiker” on the list of animals that volunteers could choose from. I’ve labeled this duiker as “New animal” on the pie chart.
Then the rest of the captures — just over a quarter of them — were what I’d call real errors. Grant’s gazelles mistaken for Tommies. Buffalo mistaken for wildebeest. Aardwolves mistaken for striped hyenas. That sort of thing. They account for just 1.1% of all the 4,149 captures.
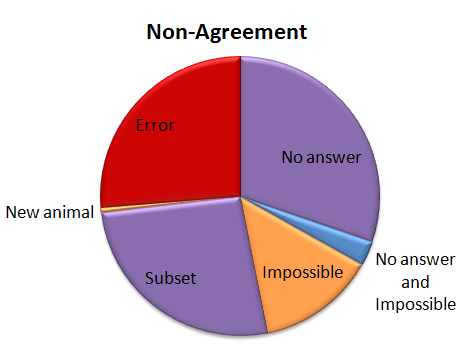
I’ve given the above Non-agreement pie chart some hideous colors. The regions in purple are what scientists call Type II errors, or “false negatives.” That is, the algorithm is failing to identify a species that we know is there — either because it comes up with no answer, or because it misses extra species in a capture. I’m not too terribly worried about these Type II errors. The “Subset” ones happen mainly with very common animals (like zebra or wildebeest) or animals that we’re not directly studying (like Other Birds), so they won’t affect our analyses. The “No answers” may mean we miss some rare species, but if we’re analyzing common species, it won’t be a problem to be missing a small fraction of them.
The regions in orange are a little more concerning; these are the Type I errors, or “false positives.” These are images that should be discarded from analysis because there is no useful information in them for the research we want to do. But our algorithm identifies a species in the images anyway. These may be some of the hardest captures to deal with as we work on our algorithm.
And the red-colored errors are obviously a concern, too. The next step is to incorporate some smarts into our simple algorithm. Information about camera location, time of day, and identification of species in captures immediately before or following a capture can give us additional information to try to get that 4.2% non-agreement even smaller.
Drumroll, please
If you’ve been following Margaret’s blogs, you’ve known this moment was coming. So stop what you’re doing, put down your pens and pencils, and open up your internet browsers, folks, because Season 5 is here!
It’s been an admittedly long wait. Season 5 represents photos from June – December 2012. During those six months I was back here in Minnesota, working with Margaret and the amazing team at Zooniverse to launch Snapshot Serengeti; meanwhile, in Serengeti, Stanslaus Mwampeta was working hard to keep the camera trap survey going. I mailed the Season 5 photos back as soon as possible after returning to Serengeti – but the vagaries of cross-continental postal service were against us, and it took nearly 5 months to get these images from Serengeti to Minnesota, where they could be prepped for the Snapshot interface.
So now that you’ve finally kicked the habit, get ready to dive back in. As with Season 4, the photos in Season 5 have never been seen before. Your eyes are the first. And you might see some really exciting things.
For starters, you won’t see as many wildebeest. By now, they’ve moved back to the north – northern Serengeti as well as Kenya’s Masaai Mara – where more frequent rains keep the grass long and lush year-round. Here, June marks the onslaught of the dry season. From June through October, if not later, everything is covered in a relentless layer of dust. After three months without a drop of rain, we start to wonder if the water in our six 3,000 liter tanks will last us another two months. We ration laundry to one dusty load a week, and showers to every few field days. We’ve always made it through so far, but sometimes barely…and often rather smelly.
You might see Stan

Norbert

And occasionally Daniel

Or me
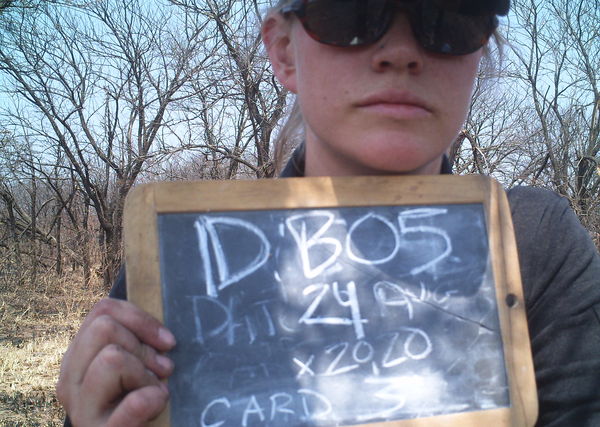
Checking the camera traps.
But most excitingly, you might see African wild dogs.

photo nabbed from: http://en.wikipedia.org/wiki/File:LycaonPictus.jpg
Also known as the Cape hunting dog or painted hunting dog, these canines disappeared from Serengeti in the early 1990’s. While various factors may have contributed to their decline, wild dog populations have lurked just outside the Serengeti, in multi-use protected areas (e.g. with people, cows, and few lions) for at least 10 years. Many researchers suspect that wild dogs have failed to recolonize their previous home-ranges inside the park because lion populations have nearly tripled – and as you saw in “Big, Mean, & Nasty”, lions do not make living easy for African wild dogs.
Nonetheless, the Tanzanian government has initiated a wild dog relocation program that hopes to bring wild dogs back to Serengeti, where they thrived several decades ago. In August 2012, and again in December, the Serengeti National Park authorities released a total of 29 wild dogs in the western corridor of the park. While the release area is well outside of the camera survey area, rumor has it that the dogs booked it across the park, through the camera survey, on their journey to the hills of Loliondo. Only a handful of people have seen these newly released dogs in person, but it’s possible they’ve been caught on camera. So keep your eyes peeled! And if you see something that might be a wild dog, please tag it with #wild-dog!! Happy hunting!
Living with lions
A few weeks ago, I wrote about how awful lions are to other large carnivores. Basically, lions harass, steal food from, and even kill hyenas, cheetahs, leopards, and wild dogs. Their aggression usually has no visible justification (e.g. they don’t eat the cheetahs they kill), but can have devastating effects. One of my main research goals is to understand how hyenas, leopards, cheetahs, and wild dogs survive with lions. As I mentioned the other week, I think the secret may lie in how these smaller carnivores use the landscape to avoid interacting with lions.
Top predators (the big ones doing the chasing and killing) can create what we call a “landscape of fear” that essentially reduces the amount of land available to smaller predators. Smaller predators are so afraid of encountering the big guys that they avoid using large chunks of the landscape altogether. One of my favorite illustrations of this pattern is the map below, which shows how swift foxes restrict their territories to the no-man’s land between coyote territories.
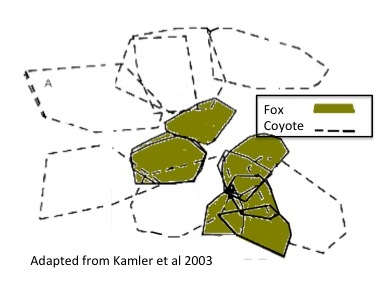
A map of coyote and swift fox territories in Texas. Foxes are so afraid of encountering coyotes that they restrict their territories into the spaces between coyote ranges.
The habitat inside the coyote territories is just as good, if not better, for the foxes, but the risk of encountering a coyote is too great. By restricting their habitat use to the areas outside coyote territories, swift foxes have essentially suffered from habitat loss, meaning that they have less land and fewer resources to support their population. There’s growing evidence that this effective habitat loss may be the mechanism driving suppression in smaller predators. In fact, this habitat loss may have larger consequences on a population than direct killing by the top predator!
While some animals are displaced from large areas, others may be able to avoid top predators at a much finer scale. They may still use the same general areas, but use scent or noise to avoid actually running into a lion (or coyote). This is called fine-scale avoidance, and I think animals that can achieve fine-scale avoidance, instead of suffering from large-scale displacement, manage to coexist.
The camera traps are, fingers crossed, going to help me understand at what scale hyenas, leopards, cheetahs, and wild dogs avoid lions. My general hypothesis is that if these species are generally displaced from lion territories, and suffer effective habitat loss, their populations should decline as lion populations grow. If instead they are able to use the land within lion territories, avoiding lions by shifting their patterns of habitat use or changing the time of day they are active, then I expect them to coexist with lions pretty well.
So what have we seen so far? Stay tuned – I’ll share some preliminary results next week!
#####
Map adapted from: Kamler, J.F., Ballard, W.B., Gilliland, R.L., and Mote, K. (2003b). Spatial relationships between swift foxes and coyotes in northwestern Texas. Canadian Journal of Zoology 81, 168–172.
Good News Bad News
So there’s good news and there’s bad news. Which would you like first? Good news?
The good news is that the pictures from Season 5 are being processed at the Minnesota Supercomputer Institute right this minute. There are about 900,000 images total, so it will take a few days to process them all. (What are we doing? We’re resizing them, extracting the place and time they were taken, and grouping those that need it into groups of 3.) Then we’ll need to upload them to Zooniverse’s servers. That might take another day or so. If everything goes without a hitch (fingers crossed), we’ll be ready to unleash Season 5 by the end of next week! (So for those of you who wanted some warning, this is your warning. Clear you schedules. Get your work done early. Set up an ‘away’ message on your email…)

Sneak Preview of Season 5 (July to December 2012)
The other news is bad, I’m afraid. We just found out that the grant proposal we wrote to the National Science Foundation back in January got turned down. Our grant would have funded Snapshot Serengeti and the Serengeti Lion Project for another five years, and included money for scientists to continue to analyze all the data you’ve been generating by identifying animals in the Snapshot Serengeti images.
Our proposal was reviewed by three other scientists independently and then talked about by a group of scientists who had our proposal and the three reviews to look at. Our three reviews varied. One person thought that our proposal was the most exciting project s/he had read yet this year. But the others were a bit concerned about exactly how we would analyze the data. This proposal was a “pre-proposal,” meaning that we only had a few pages to explain what we wanted to do, how we would do it, why it’s important, and the broader impact we would have. I guess we didn’t manage to get in enough of the “how” for these reviewers.
We were all taken by surprise by the rejection. The Lion Research Center has been reliably funded by the National Science Foundation for decades. But things are changing. Firstly, this “pre-proposal” system is new; it’s only in its second year. And everyone — both proposal writers and proposal reviewers — are still figuring out what exactly should go in the new shorter pre-proposals. And secondly, the Sequester is still in place, so the National Science Foundation has less money to give out this coming year than usual.
In any case, we’re now regrouping to come up with a new funding plan. We’ll be able to apply again to the National Science Foundation in January 2014 to fund camera trapping starting in 2015. And we’ve got several papers that we plan to write in the next six months using Snapshot Serengeti data that we’ll be able to point to to show reviewers that we can properly analyze the data. Meanwhile, we’re going to try to keep the cameras rolling by looking for other funding sources to cover our year-long funding gap. Suggestions welcome.
Detecting the right number of animals
This past spring, four seniors in the University of Minnesota’s Department of Fisheries, Wildlife, and Conservation Biology took a class called “Analysis of Populations,” taught by Professor Todd Arnold. Layne Warner, Samantha Helle, Rachel Leuthard, and Jessica Bass decided to use Snapshot Serengeti data for their major project in the course.
Their main question was to ask whether the Snapshot Serengeti images are giving us good information about the number of animals in each picture. If you’ve been reading the blog for a while, you know that I’ve been exploring whether it’s possible to correctly identify the species in each picture, but I haven’t yet looked at how well we do with the actual number of animals. So I’m really excited about their project and their results.
Since the semester is winding up, I thought we’d try something that some other Zooniverse projects have done: a video chat*. So here I am talking with Layne, Samantha, and Rachel (Jessica couldn’t make it) about their project. And Ali just got back to Minnesota from Serengeti, so she joined in, too.
Here are examples of the four types of covariates (i.e. potential problems) that the team looked at: Herd, Distance, Period, Vegetation
Herd: animals are hard to count because they are in groups

Herd
Distance: animals are hard to count because they are very close to or very far from the camera

Distance
Period: animals are hard to count because of the time of day

Period
Vegetation: animals are hard to count because of surrounding vegetation

Vegetation
* This was our first foray into video, so please excuse the wobbly camera and audio problems. We’ll try to do better next time…
Complex Landscapes
This past week I’ve been reworking a paper about a study with Anna Mosser and Craig. The study asks the question: How did lions come to live in groups? It doesn’t seem like group-living in lions would be something you would spend much time thinking about – until you realize that lions are the only cat that regularly lives in groups. What’s special about lions?
Craig’s work over the past decades has shown that seemingly intuitive ideas about why lions form groups are wrong. Lions don’t form groups in order to hunt more efficiently. Lions don’t form groups to cooperatively nurse their young. Lions don’t form groups to protect young against aggressive outsiders. Instead, it appears that the primary purpose of lion groups is to defend territories against other groups of lions.
So territorial defense appears to be the key to group living in lions. But is territorial defense the only thing that matters? That’s what we set out to investigate. We created a computer model that simulates a bunch of lions living on a landscape. The model is a simplification of what happens in real life, but it contains some essential aspects of lion living.
First, we have complex landscapes. Previous research suggests that group territoriality is more likely in complex landscapes because there are highly desirable areas that are worth defending. If you had a landscape where everything was more or less the same, then you wouldn’t need to fight your neighbor over some small patch of it; you could just wander off and find your own patch that would be more-or-less the same quality as your neighbor’s.
Second, we have various behaviors that we can turn on or off in our simulated lions. For example, we can tell them that they can live together in a territory, but they can’t cooperate to defend it. We can also tell them whether or not they can live in a territory with their parents when they grow up. And we can tell them whether they’re allowed to make their territory bigger if they recruit more lions into their group.
By manipulating the types of landscapes and the various behaviors, we explored how often our simulated lions formed groups. Our results suggest that while territorial defense is important, it’s also important to have complex landscapes with high-value real estate. If the landscape isn’t very complex, then it’s easy enough to find an area to set up a territory without fighting for it. And if the landscape is complex, but doesn’t have any areas with high value, then there’s nothing worth fighting for or defending. It’s also important that lions be able to pass their valuable territories on to their offspring, for without inheritance, the benefits of all that fighting and defending are gone in a generation.
Lions evolved on the savannas of East Africa, where the landscape is complex with patchy areas of high value (near where rivers come together, for example). Humans did too. It’s possible that the same sorts of savanna landscapes that shaped group living and territorial defense for lions did so for people, as well.
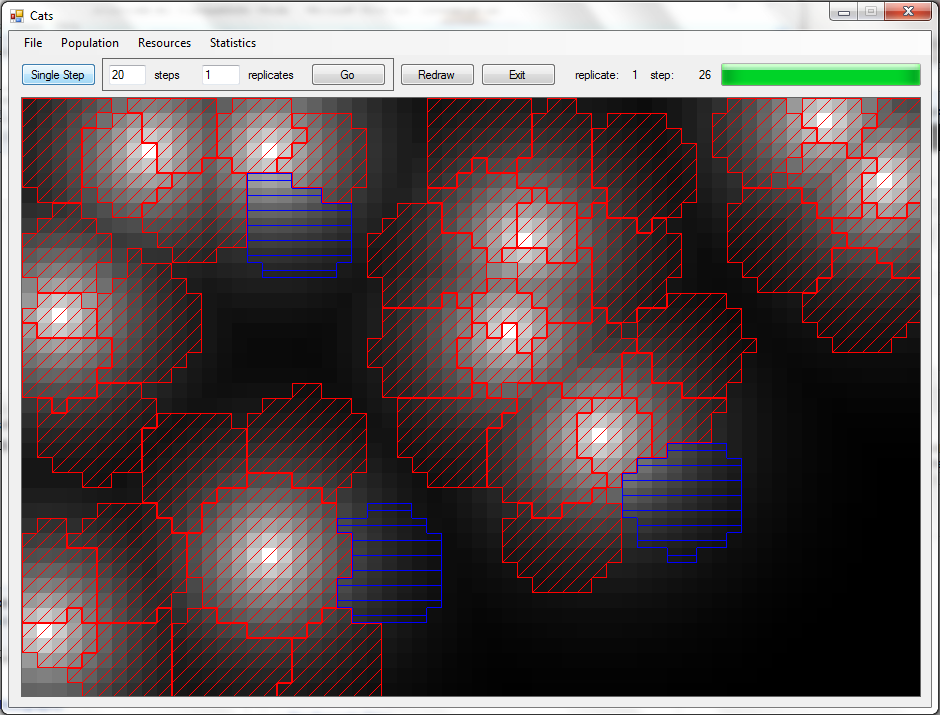
The simulation model. White areas are high-value real-estate, while black areas are low-value. Red shapes show where lions have formed a group territory, while blue shapes show where there’s a territory defended by just a single lion.
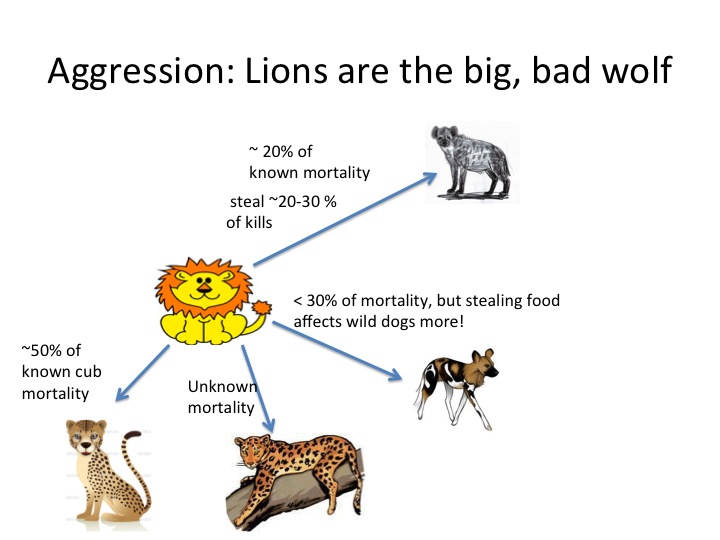
Big, Mean, & Nasty

I recently gave a talk at the Arusha-based Interpretive Guide Society – a really cool group of people interested in learning more about the natural history of Tanzania’s places and animals. I’ve taken a few clips from the presentation that describe in a bit more detail how lions bully their competitors.
Looking at the photos above (all nabbed from the internet), how many of you would like to be a wild dog? A leopard? A cheetah? There’s no doubt about it – lions are big, and mean and nasty. If you are any other carnivore species in the Serengeti – or across Africa, lions chase you, steal your food, even kill you. So what do you do? How do you survive? That’s essentially what my dissertation seeks to answer. How smaller “large carnivores” – hyenas, leopards, cheetahs, and wild dogs — live with lions. Under what circumstances do they persist? Under what circumstances do they decline or even disappear?
There are a handful of ways in which these species interact, but what I’m most interested in is aggression and it’s repercussions. As the above pictures suggest, lions tend to dominate aggressive interactions.
The relationship between lions and hyenas is one that has wormed its way into the public psyche through nature documentaries such as “Eternal Enemies.” While such movies play up the frequency of such interactions, they certainly do happen. Lions not only kill a number of hyenas, but steal their hard-won kills. Dispel any notion of lions as some noble hunter — they in fact steal a lot of their food from other carnivores. In fact, research from Kay Holekamp’s group in Masaai Mara indicates that lions can suppress hyena populations just because they steal food from them! It’s actually a similar story for wild dogs – lions kill wild dogs too, but since wild dogs expend so much energy hunting, that if lions steal just a small fraction of the food that wild dogs catch, wild dogs simply cannot recover. They would have to hunt for more hours than there are in a day to make up for this caloric loss.
It doesn’t stop there. We don’t know how much food lions steal from cheetahs or leopards. We also don’t know how often lions kill leopards, but lions kill cheetah cubs left and right. Studies from Serengeti indicate that lions may be responsible for up to 57% of cheetah cub mortality!

So how do hyenas, wild dogs, leopards, and cheetahs survive? Well, that’s what I’m trying to figure out. But what I can tell you is that not all of these smaller carnivores sit back and take their beating quietly. Take hyenas. They’re about 1/3 the size of a lion, but they live in groups. Big groups. Much bigger groups than lions. And if there are no male lions around, if hyenas have strength in numbers, they can steal food from female lions, and even kill their cubs. While leopards don’t live in groups, they can easily kill (and eat!) a lion cub that has been hidden while mom is away hunting.
Unfortunately, what we don’t know is whether this reciprocal aggression by leopards and hyenas has any measurable affect on lion populations, and whether it’s this aggression that allows hyenas and leopards to coexist with lions. The cameras behind Snapshot Serengeti will provide the first-ever map of leopard and hyena distributions within the long-term lion study area – by comparing lion reproductive success (which we know from >45 years of watching individually identified animals) to leopard and hyena distributions, we can see if lions do better or worse in areas with lots of hyenas or leopards – and whether this is due to getting less food or producing fewer cubs.

What about cheetahs and wild dogs? Even though wild dogs, like hyenas, live in groups, there’s no evidence that this helps them defend themselves or their kills against lions. And cheetahs, well, there’s no record of them killing lion cubs, but who knows?
So how do these guys live with lions? To be honest, wild dogs don’t tend to do very well in places with lots of lions. In fact, it’s generally believed that wild dogs have failed to recolonize Serengeti, despite living *just* a few km from the border, because lion populations are so high. For a long time, researchers and conservationists believed that cheetahs also couldn’t survive in places with lots of lions – but that perception is beginning to change, due, in part, to data coming in from Snapshot Serengeti! It seems that cheetahs not only do just fine in reserves with lots of lions, but use the same areas within the park as lions do. I have a sneaking suspicion that how cheetahs use the habitat with respect to lions, how they avoid encountering lions even though they’re in the same places, holds the key to their success. Avoidance, combined with habitat that makes avoidance possible (read: not the short grass Serengeti plains you see below).
I’ll write more about avoidance and habitat another day. In fact, I’m currently revising a paper for a peer-reviewed journal that addresses how cheetahs and wild dogs differ in the ways they avoid lions – if accepted, it will be the first appearance of Snapshot Serengeti data in the scientific literature! I’ll keep you posted…
Data-palooza
You might remember the Kibumbu pride from their rather gruesome encounter with a leopard. But probably not – that was a long time ago.
They now have a new claim to fame. As of April 22, 2013, the Kibumbu lions became the first Serengeti pride to bear a GPS collar. GPS collars are cool, but if you are a nerd like me, and trying to calibrate 225 camera traps against the known reality of animal movements, GPS collars are really [expletive deleted] cool.
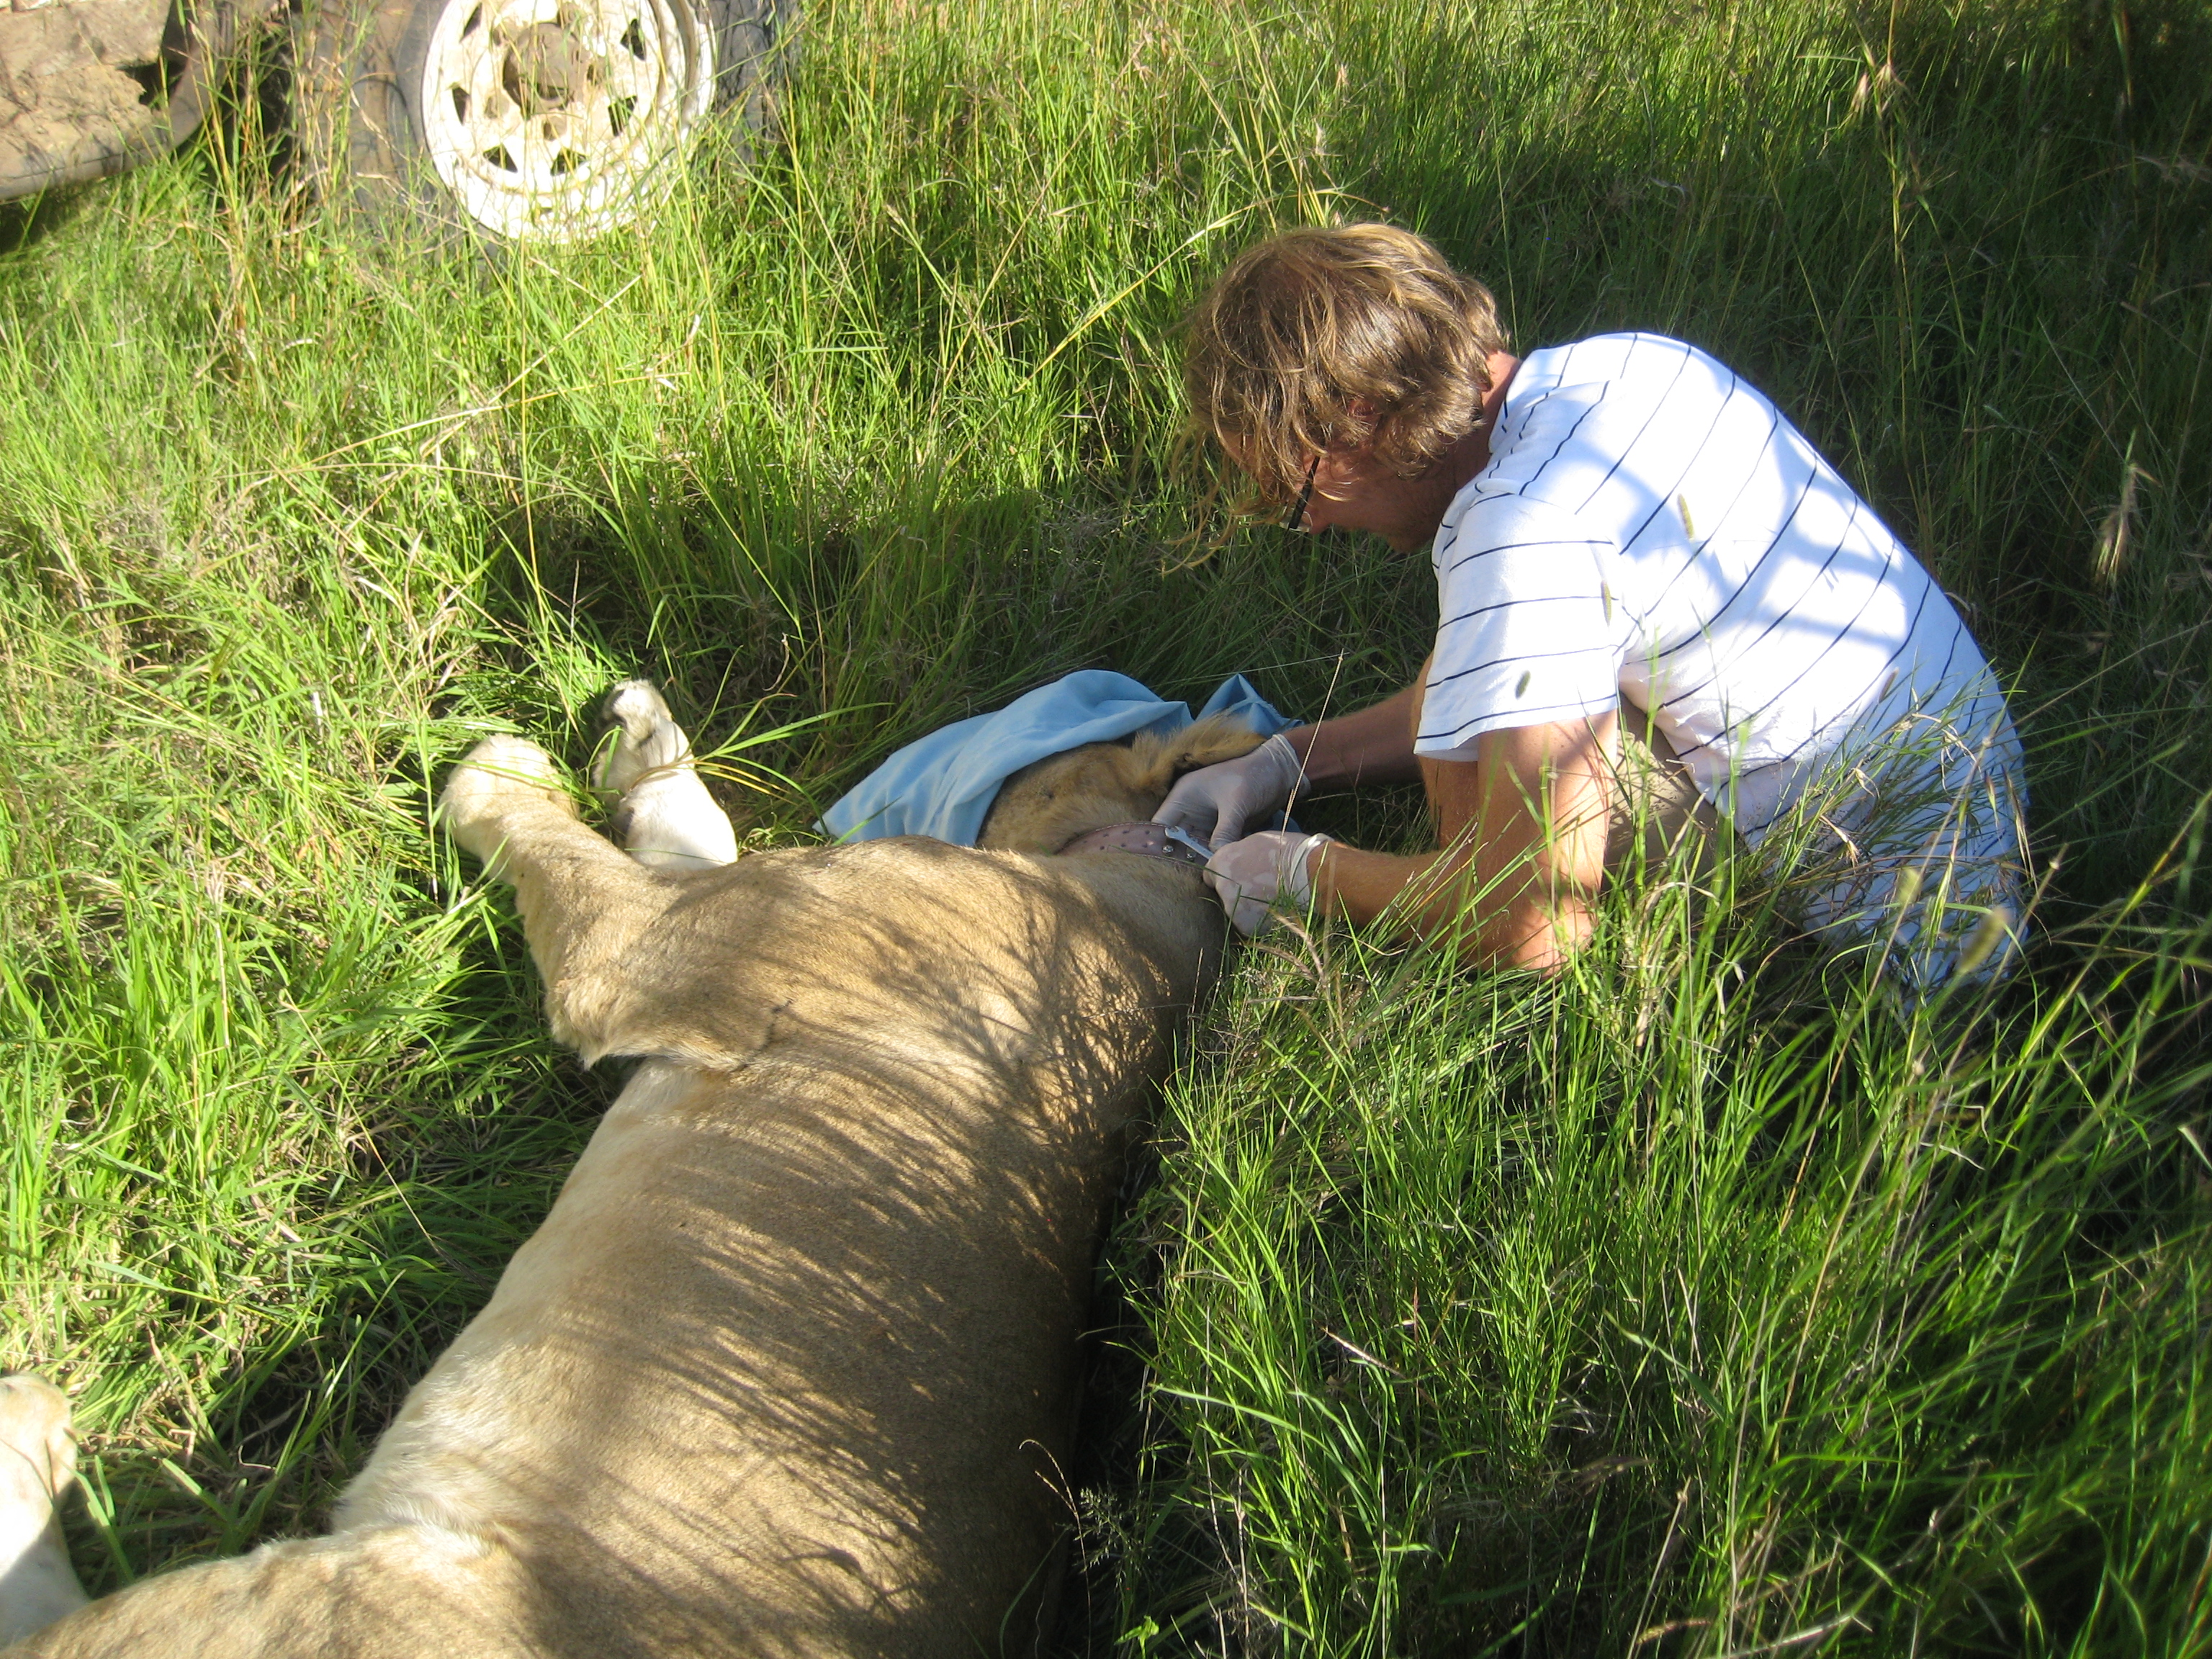
Daniel collaring a study lion
With regular old radio-collars, we have to get out in the field, driving (seemingly aimlessly to bystanders) in circles on hills until we get a signal in the direction of a given lion pride. With 26 prides being monitored now, we get to each pride about once a week. But with GPS collars, the data comes to US. On it’s own. EVERY HOUR. I can tell you where the lions are without ever leaving my hyena-chewed, baboom-mangled armchair. Data of this richness are simply impossible to get otherwise. I tried a few “all-night follows” – trying to serve as a living GPS collar. Trying to figure out why, when lions are lurking 300 meters from a camera trap, they don’t appear in it. I usually fall asleep by 9pm. Apparently I don’t make a very good GPS collar.
You might wonder why on earth we don’t have 26 GPS collars, instead of 1. Unfortunately, they are expensive (read >$5,500 a pop), and the battery life doesn’t last as long as regular old VHF collars, meaning we would have to dart lions more often – which is a stress that we like to minimize. But Ingela Janssen had an extra collar from her conservation work in the Ngorongoro Conservation Area, and the chance of calibrating camera trap captures against hourly lion movements was too good to pass up!
Here’s the first map of Kibumbu’s movements. The first position came in at 6pm on April 22, and the last was recorded on the 23rd at 9pm. Since lions are nocturnal, we take one position every hour from 6pm to 7am, and then one position during the day (at noon). You can see from the lines that lions can move quite a ways without actually getting very far.

Kibumbu’s first GPS recorded movements
And here’s their latest map.

And the last few weeks…
I realize that these graphics don’t give you any sense of where in the study area the lions are. Until I figure out how to work some really cool magic with Google Earth, here’s a map of where the cameras are. You can see from Kibumbu’s maps that they are hanging out along a (sometimes dry) river – the Ngare Nanyuki – which I’ve circled in red on this camera layout map.

Camera Traps – Ngare Nanyuki River circled
The GPS collar won’t show up until Season 6 camera photos — but it looks a bit different from our normal collars with two big lumps instead of one:

Vectronic GPS collar – stock image
So keep your eyes peeled!
