
The joys of poster presentation
As Meredith mentioned last week, she, Craig, and I are counting down the days until we head out to sunny California for an academic conference. I am really looking forward to above-zero temperatures. I am rather less enthused about the prospect of presenting a poster. Yes, it is good networking. Yes, I get to personally advertise results from a study that are currently in review at a journal (and hopefully will be published “soon”). Yes, I get to engage with brilliant minds whose research I have read forward, backwards, and sideways. Despite all of that, I’m still not excited.
Poster-ing is perhaps the most awkward component of an academic conference. Academics are not known for their mingling skills. Add to that the inherent awkwardness of having to lurk like an ambush predator by your poster while fellow ever-so-socially-savvy scientists trudge through the narrow aisle ways, trying to sneak non-committal glances at figures and headings without pausing long enough for the poster-presenter to pounce with their “poster spiel.” For the browsers who do stop and study your poster, you have stand there pretending that you aren’t just standing there breathing down their necks while they try to read your poster until they decide that a) this is really interesting and they want to talk to you, or b) phew that was close, they almost got roped into having to talk to you about something they know/care nothing about. Most conferences have figure out that poster sessions are a lot less painful if beer is served.
Working with big, fuzzy animals means that I usually get a pretty decent sized crowd at my posters. About half of those people want to ask me about job opportunities or to tell me about the time that they worked in a wildlife sanctuary and got to hug a lion and do I get to hug lions when I’m working? I once had a pleistocene re-wilding advocate approach me for advice on – no joke – introducing African lions into suburban America. But they aren’t all bad. I’ve met a number of people in poster sessions who have gone on to become respected colleagues and casual friends. I’ve met faculty members whose labs I am now applying to for post-doctoral research positions. And I’ve learned how to condense a 20-page paper into a 2 minute monologue — which is a remarkably handy skill to have.
As much as I gripe and grumble about poster sessions, I know they’re good for me. At least with this one, I’ll be close to the beach!!
Below is a copy of my (draft) poster for the upcoming Gordon Research Conference that a chunk of the Snapshot Serengeti team will be at. It’s mostly on data outside of Snapshot Serengeti, but you might find it interesting nonetheless! (Minor suggestions and typo corrections welcome! I know I still have to add a legend or two…)

At 4 feet by 4 feet, this thing is a beast!
Fear
I have successfully survived the trials and tribulations of my first semester of graduate school! Huzzah! That being said, a student’s work is never done – you can still find me sitting in my office, plugging away at data and up to my eyeballs in pdfs and textbooks. Although it certainly helps when I know that, in a few short weeks, I’ll be showing off my preliminary data on a nice warm beach in California. Well, the Gordon Research Conference that Ali and I will both be attending will probably not be held directly ON the beach, but it’s a nice fantasy to have when your fingers are freezing off in Minnesota.
The theme of the conference is predator-prey interactions, but approached from a very interdisciplinary standpoint. Topics range from genes and the causes of childhood anxiety up through ecosystems, evolution, and Craig’s presentation on man-eating lions. It’s been over a year since I last attended a conference, and it’s going to be intimidating and inspiring to meet the Who’s Who in our field. All the papers piled up around my desk, underlined and annotated and thoroughly mulled over? Hopefully I’ll have a chance to chat with their authors in person and get these scientists’ input on the direction of my current research ideas.
My particular focus, predator intimidation (“fear”), is delightfully billed in the conference descriptions as “the persistent threat of immediate violent death.” The blurb continues on to state that “most wild animals are in peril every moment of every day of being torn limb from limb by any number of predators.” Language far more colorful that I can get away with in most of my proposals, but certainly right on point! There will be talks on fear’s impacts on evolutionary ecology and population- and ecosystem-level processes as well as about the effect of predators as stressors that I’m am particularly keen to attend.
As excited as I am, I’m honestly a bit frantic trying to synthesize our Snapshot data to produce distribution graphs and other basic preliminary results. A few months ago, I couldn’t have programmed my own name into “R” – the bread and butter statistical program of beloved (well, it’s a bittersweet relationship) by biologists. With long evenings in front of the computer and by the generous grace and goodwill of Ali, I’ve been making progress. Ideally, I would like to show up to this conference with not only an outline of my research to be picked apart by the aforementioned greatest minds in the field, but also with maps of the monthly distributions of several herbivore species in relation the changing vegetative landscape and predator movements. No breakthroughs so far; I foresee a great deal of coffee in my future between now and January…
P.S. Congrats to Margaret for defending her PhD!!!
Things are looking up!
I’ve got to echo Margaret’s apology for our sporadic blog posts lately. Things have been a bit hectic for all of us — Dr (!!!) Margaret Kosmala is finishing up her dissertation revisions and moving on to an exciting post-doctoral position at Harvard, our latest addition, Meredith, is finishing up her first semester (finals! ah!), and I’m knee deep in analyses (and snow!).
So,\ please bear with us through the craziness and rest assured that we’ll pick up the blog posts again after the holidays. In the meanwhile, I’ll show you something that got me really excited last week. (Warning: this involves graphs, not cute pictures.)
Last week, I was summarizing some of the Snapshot Serengeti data to present to my committee members. (My committee is the group of faculty members that eventually decide whether my research warrants a PhD, so holding these meetings is always a little nerve-wracking.) As a quick summary, I made this graph of the total number of photographs of the top carnivores. Note that I’m currently only working with data from Seasons 1-3, since we’re having trouble with the timestamps from Seasons 4-6, so the numbers below are about half of what I’ll eventually be able to analyze.
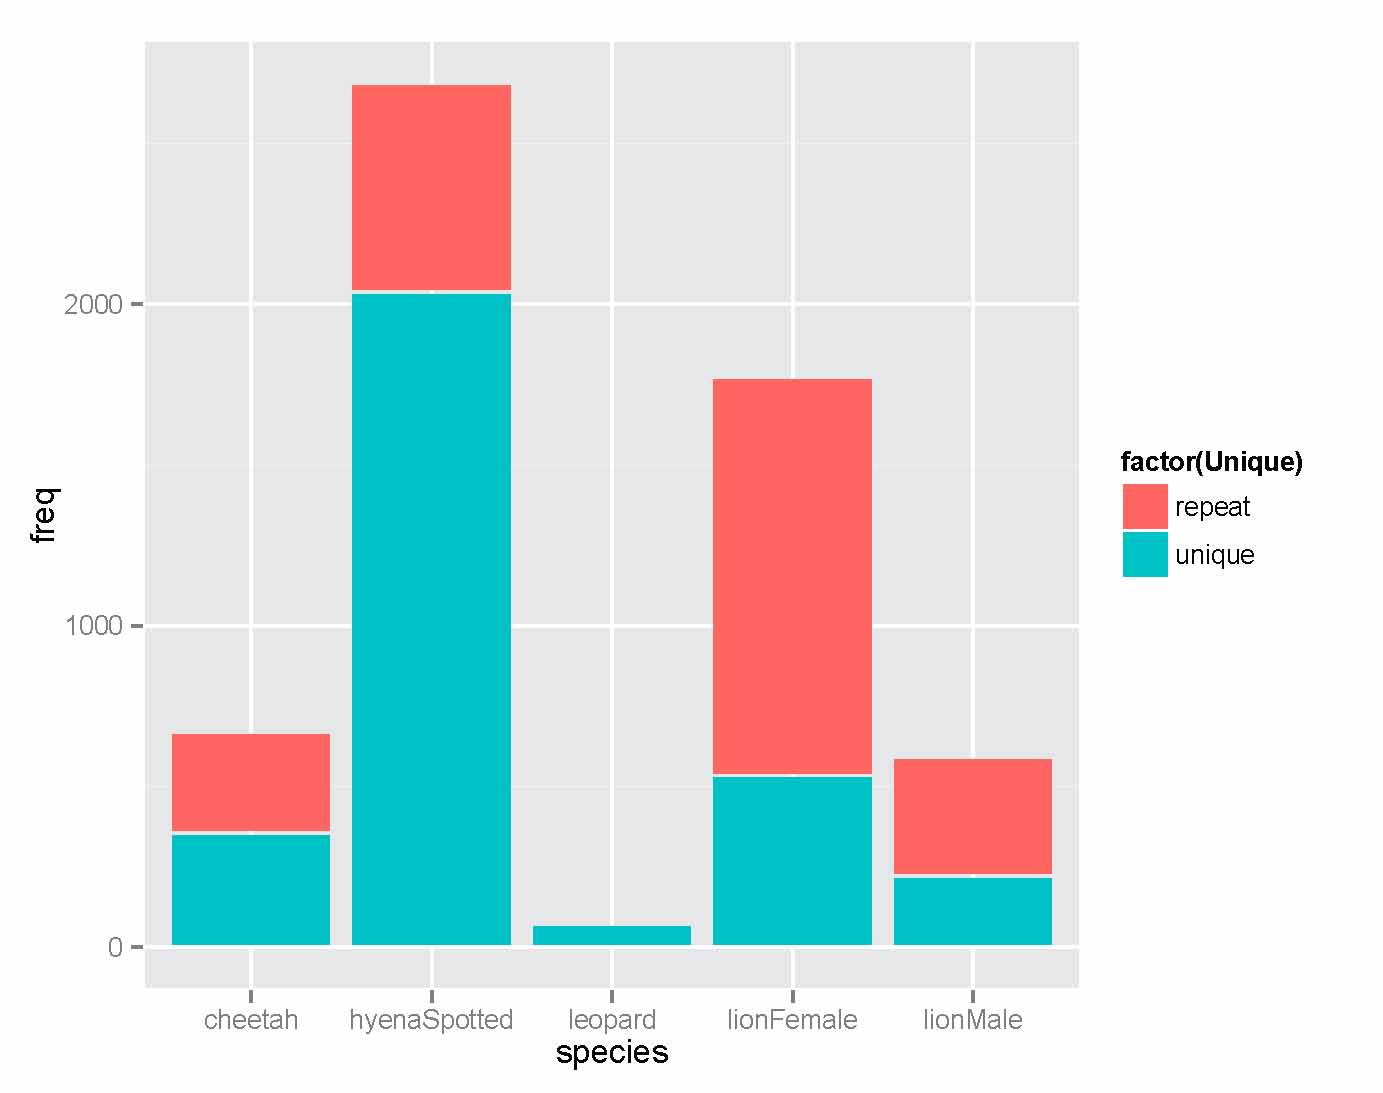
The height of each bar represents the total number of pictures for each species. The color of the bar reflects whether or not a sighting is “unique” or “repeat.” Repeated sightings happen when an animal plops down in front of the camera for a period of time, and we get lots and lots of photos of it. This most likely happens when animals seek out shade to lie in. Notice that lions have wayyyy more repeated sightings percentage-wise than other species. This makes sense — while we do occasionally see cheetahs and hyenas conked out in front of a well-shaded camera, this is a much bigger issue for lions.
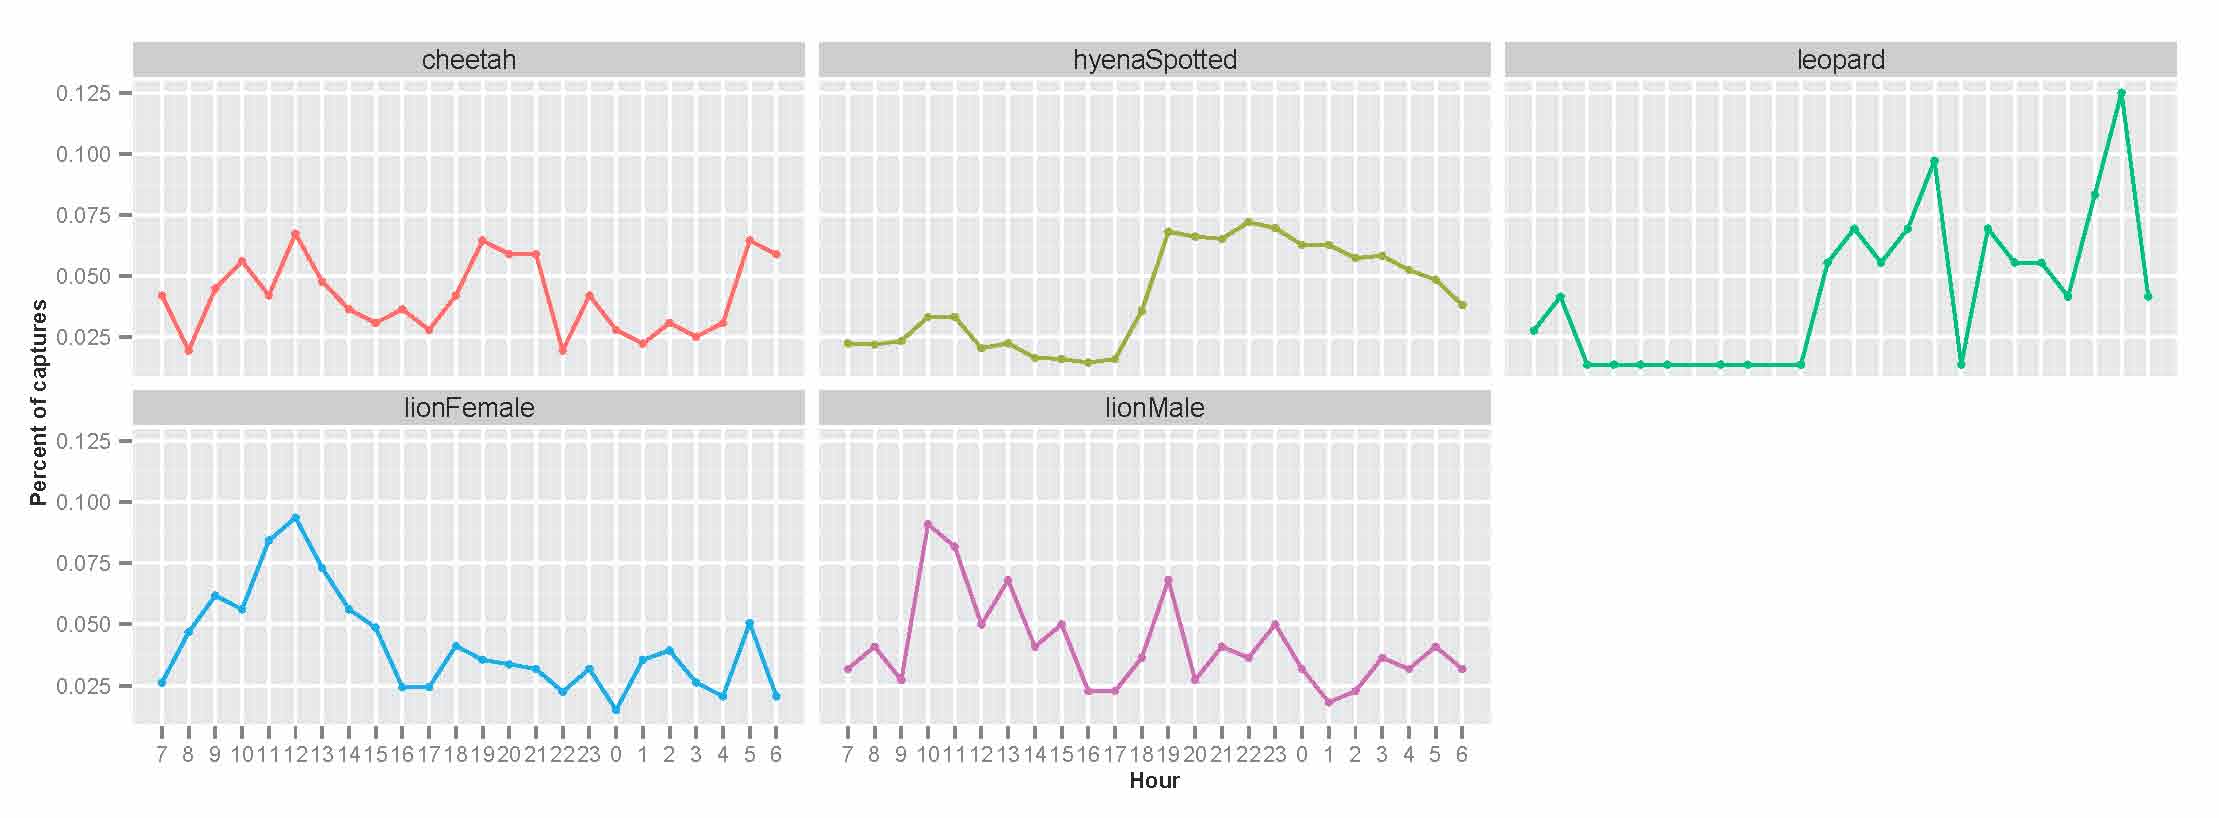
I also dived a little deeper into the temporal patterns of activity for each species. The next graph shows the number of unique camera trap captures of each species for every hour of the day. See the huge spike in lion photos from 10am-2pm? It’s weird, right? Lions, like the other carnivores, are mostly nocturnal….so why are there so many photos of them at midday? Well, these photos are almost always lions who have wandered over for a well-shaded naptime snoozing spot. While there are a fair number of cheetahs who seem to do this too, it doesn’t seem to be as big of a deal for hyenas or leopards.
Why is this so exciting? Well, recall how I’ve repeatedly lamented about the way shade biases camera trap captures of lions? Because lions are so drawn to nice, shady trees, we get these camera trap hotspots that don’t match up with our lion radio-collar data. The map below shows lion densities, with highest densities in green, and camera traps in circles. The bigger the circle, the more lions were seen there.

The “lion hotspots” in relatively low density lion areas have been driving me mad all year. These are nice, shady trees that lions are drawn to from up to several kilometers away, and I’ve been struggling to reconcile the lion radio-collar data with the camera trapping data.
What the graphs above suggest, though, is that there likely to be much less bias for hyenas and leopards. Lions are drawn to shade, because they are big and bulky and easily overheated. We see this in the data in the form of many repeated sightings (indicating that lions like to lie down in one spot for hours) and in the “naptime spike” in the timing of camera trap captures that suggest lions seeking out shade trees to go to. Although this remains a bit of an issue for cheetahs, what the graphs above suggest is that using camera traps to understand hyena and leopard activity will be much less biased and much more straightforward — ultimately, much easier than it is for lions. And this is really good news for me.
Analyses galore
Last week I posted an animated GIF of hourly carnivore sightings. To clarify, the map showed patterns of temporal activity across all days over the last 3 years — so the map at 9am shows sites where lions, leopards, cheetahs, and hyenas like to be in general at that time of day (not on any one specific day).
These maps here actually show where the carnivores are on consecutive days and months (the dates are printed across the top). [For whatever reason, the embedded .GIFs hate me; click on the map to open in a new tab and see the animation!]
Keep in mind that in the early days (June-Sept 2010) we didn’t have a whole lot of cameras on the ground, and that the cameras were taken down from Nov 2010-Feb 2011 (so that’s why those maps are empty).

Carnivores captured on any given day across the study area
The day-by-day map is pretty sparse, and in fact looks pretty random. The take-home message for this is that lions, hyenas, cheetahs, and leopards are all *around*, but the chances of them walking past a camera on any given day are kinda low. I’m still trying to find a pattern in the monthly distributions below.

Carnivore captures per month
So this is what I’ve been staring at in my turkey-induced post-Thanksgiving coma. Could be worse!
Let the analyses begin!
Truth be told, I *have* been working on data analysis from the start. It’s actually one of my favorite parts of research — piecing together the story from all the different puzzle pieces that have been collected over the years.
But right now I am knee-deep in taking a closer look at the camera trap data. Since we have *so* many cameras taking pictures every day I want to look at where the animals are not just overall, but from day to day, hour to hour. I’m not 100% sure what analytical approaches are out there, but my first step is to simply visualize the data. What does it look like?
So I’ve started making animations within the statistical programming software R. Here’s one of my first ones (stay tuned over the holidays for more). Each frame represents a different hour on the 24 hour clock: 0 is midnight, 12 is noon, 23 is 11pm, etc. Each dot is sized proportionally to the number of captures of that species at that site at that time of day. The dots are set to be a little transparent so you can see when sites are hotspots for multiple species. [*note: if the .gif isn’t animating for you in the blog, try clicking on it so it opens in a new tab.]
 It’s pretty clear that there are a handful of “naptime hotspots” on the plains. You can bet your boots that those are nice shady trees in the middle of nowhere that the lions really love.
Graduate School
Maybe from time to time you’ve wondered: Who are these scientists running Snapshot Serengeti? How did they get where they are? (And why am I sitting here instead of traipsing across the Serengeti myself?)
Ali and I are both graduate students at the University of Minnesota. What that means is that a while ago (seven years for me!) we filled out an application and wrote some essays for admission to the University of Minnesota’s graduate school — just like you would do for college admissions. The difference is that for graduate school, you also need to identify an advisor — a faculty member who will become both your mentor and your judge — and an area of research that you want to pursue. And while the admissions materials matter, it’s very important that your future advisor want to take you on as a student and that your area of research interest meshes well with hers or his.
In the U.S., you can apply for a Masters program or a Ph.D. program. In some places you can get a Masters on the way to a Ph.D., but that’s not the case at Minnesota. So I applied for the Ph.D., got admitted and started as a Ph.D. student in the fall of 2007. I’m pretty much only going to talk about Ph.D.s from here on out. And I should point out that graduate school systems vary from country to country. I’m just going to talk about how it works in the U.S. because I’m not terribly familiar with what happens in other countries.
For the first 2-3 years in our program, students spend much of their time taking classes. These are mostly higher level classes that assume you already took college-level classes in basic biology, math, etc. I came in with an college degree in computer science, and so a bunch of the classes I took were actually more fundamental ecology and evolution classes so I could get caught up. But many classes are reserved for just graduate students or for grad students plus motivated seniors.
At the same time as taking these classes, students are expected to come up with a research plan to pursue. The first couple years are filled with a lot of anxiety about what exactly to do, and there are plenty of missteps. My first attempt at a research project involved tracking the movement of wildebeest in the Serengeti using satellites and airplane surveys. (Yes, you can see individual wildebeest in Google Earth if you hunt around!) But it turned out not to be a logically or financially feasible project, so I discarded it — after a lot of time and energy investment.
Around the end of the second year and beginning of the third year, grad students in the U.S. take what are called “preliminary” or “comprehensive” exams. These vary from school to school and from department to department. But they usually consist of both a written and oral component. In some places the goal of these exams to to assess whether you know enough about the broad discipline to be allowed to proceed. In other places, the goal is to judge whether or not you’ve put together a reasonable research plan. The program Ali and I are in leans more toward the latter. It requires a written proposal about what you plan to do for research. This proposal is reviewed by several faculty who decide whether it passes or not.
If you pass your written component, you then give a public talk on your proposed research followed by a grueling two to three hour interview with your committee. In our program, students choose their committee members, following a few sets of rules about who can be on it. My committee had five people, including my two advisors. They took turns asking me questions about my proposed research, how I would collect data, analyze it, how I would deal with adversity. The committee then met without me to decide whether I passed or not. (spoiler: I passed)
So, assuming a student passes the preliminary exams, she or he is then considered a “Ph.D. Candidate,” which basically means that all requirements except the actual dissertation itself have been fulfilled. If you’ve ever heard the term “A.B.D.” or “All But Dissertation,” that is what this means. The student got through the first hurdles, but never got a dissertation done (or accepted).
Now it’s time for the research. With luck, persistence, motivation, and lack of confounding factors, a student can do the research and write the dissertation in about three years. Doing research at first is slow because, like learning anything new, you make mistakes. I spent a lot of time gathering data that I’m not going to end up using. Now that I’ve been doing research for a few years, I can better estimate which data is worth collecting and which is not. And so I’m more efficient. While doing research, the student is also reading other people’s related research, and often picking up a side-project or two.
Eventually, the student, together with the advisor(s) and committee members, decides that she or he has done enough research to prove that she or he is a capable professional scientist. All the research gets written up into a massive tome called the dissertation. These days, it’s not uncommon for graduate students in the sciences to write up their dissertation chapters as formal papers that then get published in scientific journals. Sometimes one or more chapters is already published by the time the dissertation is submitted.
When the writing of the dissertation is finished, it gets sent to the committee to read. The student then gives a formal, public talk on the results of the dissertation research, followed by another two to three hour interview with the committee. This time it’s called the “Dissertation Defense,” and the committee asks questions about the research results (and possibly asks the student to fight a snake). The committee then meets without the student and comes up with a decision of whether the student passes or not. There is also often a conditional part of this decision that requires some portion of the dissertation to be revised or added to. So, a decision of “pass, conditional on the following revisions:” is pretty common.
I should mention that while being a grad student has been mostly quite fun, you may not want to drop your day job and run off to academia just yet. There’s the issue of funding. On the plus side, you can acquire funding in the sciences so that you don’t have to take on debt to do your degree (which is not so true in the humanities). Ali and I have both applied for and received fellowships that have allowed us to do most of our graduate program without having to work. But many — maybe most — grad students in the sciences work essentially part-time jobs (20 hours/week) as teaching assistants for faculty. This can really slow down research progress, as well as making some types of research impossible (for example, those that require lengthy trips to the Serengeti). Whether working or on fellowship, students typically gross no more than $30,000 annually, and often less than $25,000, which can be quite reasonable (single person living in a low-cost-of-living area) or prohibitive (person supporting a family living in a high-cost-of-living area). Benefits are pretty much non-existent, with the exception of health coverage, which can range from great (thanks, Minnesota!) to really bad to non-existent.
I mention all this this because I am about to defend my dissertation! In a little less than two weeks I will give a talk, sit down with my committee, and try to convince them I’m a decent scientist. Wish me luck.
Animals aren’t the only thing that’s cool
Crazy week this week, so I just wanted to post a link to this fascinating and hilarious blog post about plant communication. Yup, you heard right. Animals aren’t the only things that communicate: plants do too! But instead of using sound, plants communicate via chemicals.
First, some plants respond to hungry predators (e.g. bugs, mammalian herbivores) by producing bad-tasting or toxic chemicals that stops would-be-munchers in their tracks — this is called and “induced response” or “induced defense” and is pretty well documented in terrestrial plants. But what’s even cooler is that attacked plants might also release chemical signals to “talk” to neighbors — allowing un-munched-on plants to trigger pre-emptive defenses. Originally known as the “talking trees hypothesis,” this interplant communication was first described in the 1980’s — though more recent research suggests that “eavesdropping” might better capture the true nature of the interaction.

The “talking” seaweed Ascophyllum Nodosum, image from: onlyfoods.net
More recently and perhaps even cooler is that plants not only “talk” to each other, but to other animals! The blog post linked above describes an intertidal plant that basically calls in the predators of its predators. When the plant gets munched on, by, say, a snail, it releases a chemical signal that attracts things that eat snails, like crabs.
Crazy, and awesome. Even though I think I’ll stick with studying big furry things, plants are pretty cool.
Night of the Lion
Most of you have probably seen this picture:

Kill in action
As well as the ones after it:

Joined by a pridemate.

staring out of view of the camera…

Three minutes later…

Trade-off again…

Where are the leftovers?
This series of photos was taken at site H11 along the Loyangalani river and remains, to me, one of the most amazing accomplishments of our camera trap survey to date.
First, seeing a kill is rare. In the 47 years that the Lion Project has been watching Serengeti’s lions, we’ve only seen lions with about 4,000 carcasses; of those, we’ve only actually seen them in the act of killing 1,100 animals. That might sound like a lot, but with one or two people on the ground, almost every day of the year, racking up nearly 50,000 sightings, that’s not that often.
I don’t love this series simply because this random, stationary, complacently-stuck-to-a-tree camera trap caught this rather rare event – but because it goes on to document the story that follows: A single lioness takes down a zebra much bigger than herself. Within minutes, her sister joins her (free meal!). Note how big their bellies already are though, when they begin to eat. These aren’t particularly hungry lions to begin with. About 45 minutes later, they are staring out of view of the camera, and then comes a group of hyenas. The carcass goes back and forth between them throughout the night, with a jackal darting in to sneak a nibble.
Food stealing, or kleptoparasitism, is a major part of life for Serengeti carnivores. Contrary to long-standing popular belief (reinforced by the Lion King), hyenas are not skulking scavengers living only off others’ leftovers. Hyenas are quite adept predators and scavenge only about 40% of their diet; lions scavenge at least 30% of theirs. And, in fact, lions steal a lot more food from hyenas than is apparent at first glance. More often than not, when we see hyenas lurking anxiously around a pride of lions demolishing a carcass, it’s because hyenas made the kill, and lions stole it away. Research from Kenya suggests lions might actually suppress hyena populations simply by stealing their food.
On the flip side, work from Botswana suggests that hyenas are able to steal food from lions if and only if hyenas outnumber lions by at least 4 to one, and there are no adult male lions present. (Remember, males are half again as big as females: hyenas don’t stand a chance.) But observations that Craig and a former graduate student made from the Ngorongoro Crater further revealed that even when lions do give up a kill, they are so full they can barely move – it’s simply not worth the effort to fend off hyenas any more.
So, kleptoparasitism is a part of life if you are a Serengeti carnivore, but it’s not always as simple as the movies make it out to be. It’s a pretty cool mechanism that might be driving predator dynamics though – I just wish it weren’t so hard to test!!
Better with experience
Does experience help with identifying Snapshot Serengeti images? I’ve started an analysis to find out.
I’m using the set of about 4,000 expert-classified images for this analysis. I’ve selected all the classifications that were done by logged-in volunteers on the images that had just one species in them. (It’s easier to work with images with just one species.) And I’ve thrown out all the images that experts said were “impossible.” That leaves me with 68,535 classifications for 4,084 images done by 5,096 different logged-in volunteers.
I’ve counted the number of total classifications each volunteer has done and given them a score based on those classifications. And then I’ve averaged the scores for each group of volunteers who did the same number of classifications. And here are the results:
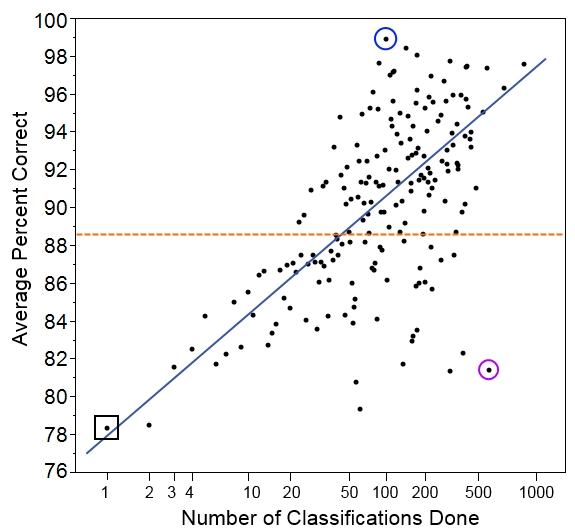
Here we have the number of classifications done on the bottom. Note that the scale is a log scale, which means that higher numbers get grouped closer together. We do this so we can more easily look at all the data on one graph. Also, we expect someone to improve more quickly with each additional classification at lower numbers of classifications.
On the left, we have the average score for each group of volunteers who did that many classifications. So, for example, the group of people who did just one classification in our set had an average score of 78.4% (black square on the graph). The group of people who did two classifications had an average score of 78.5%, and the group of people who did three classifications had an average score of 81.6%.
Overall, the five thousand volunteers got an average score of 88.6% correct (orange dotted line). Not bad, but it’s worth noting that it’s quite a bit lower than the 96.6% that we get if we pool individuals’ answers together with the plurality algorithm.
And we see that, indeed, volunteers who did more classifications tended to get a higher percentage of them correct (blue line). But there’s quite a lot of individual variation. You can see that despite doing 512 classifications in our set, one user had a score of only 81.4% (purple circle). This is a similar rate of success as you might expect for someone doing just 4 classifications! Similarly, it wasn’t the most prolific volunteer who scored the best; instead, the volunteer who did just 96 classifications got 95 correct, for a score of 99.0% (blue circle).
We have to be careful, though, because this set of images was drawn randomly from Season 4, and someone who has just one classification in our set could have already classified hundreds of images before this one. Counting the number of classifications done before the ones in this set will be my task for next time. Then I’ll be able to give a better sense of how the total number of classifications done on Snapshot Serengeti is related to how correct volunteers are. And that will give us a sense of whether people learn to identify animals better as they go along.
The short and happy life of a Serengeti lion
### Last week Craig spoke for Cafe Scientifique about lions and shared the research that Lion Project has been conducting for the last 45 years. Check out the video here. Peter and Faith, UMN undergrads conducting research in the Lion Lab, attended the talk and share their experiences as well. ####
Peter and Faith here! Last week we had the opportunity to attend the Bell Museum’s Cafe Scientifique. Cafe Scientifique allows scientists from all disciplines and specialties to share their research directly with the public in the form of a casual presentation given at the Bryant Lake Bowl in Minneapolis, MN. This past month’s talk was given by Snapshot Serengeti’s own Professor Craig Packer, giving a historic rundown of some of the highlights of the lion research conducted by the University of Minnesota’s Lion Research Center.
As prospective lion researchers ourselves, it was both interesting and valuable to hear the conclusions of past research from the perspective of the researcher. Not to mention having it be told in a casual and humorous way, which is a refreshing break from the stack of scientific papers we are usually reading! The audience, which was made up of local community members, was also engaged in the talk. Even though Dr. Packer presented complex graphs and maps, he explained the research in a way that was accessible to everyone. The studies that were discussed during the talk included the lion’s mane study, why lions form prides, and even a bit about lion conservation and the potential use of fences to protect vulnerable populations. In addition to reviewing past research, Dr. Packer also talked about the lion project’s current research–Snapshot Serengeti. The audience was amazed by how fast volunteers sorted through the millions of images on Snapshot Serengeti. (To all of you that have contributed to the success of “Snapshot”, cheers to you!) By the end of the talk, the entire audience, (including us!) had loads of insightful questions, and left with a piqued interest in the world of lion research.
