
Meeting of the minds
You’ll have to forgive me if I am less eloquent than I’d like to be. It’s late Sunday night, and my brain is still reeling from one of the most intellectually exciting and intense weeks I think my Ph.D. career has seen.
Right. So. Craig, Meredith, and I spent the last week at the first ever Gordon Research Conference on Predator-Prey Interactions. It was quite the meeting-of-the-minds for ecologists, and I spent much of the week rather star-struck. See, while much of our scientific careers are spent collecting, cleaning, and analyzing data (not to mention trying to convince funding agencies that they should give us money), a significant portion of our time also goes towards pouring over the thoughts, insights, and experiences of other researchers as they are articulated in scientific journal articles. We are impressed and sometimes awed by their insight. Our own scientific aspirations are shaped by their creativity and vision.
At the GRC last week, I had a chance to meet the movers and shakers who fundamentally shape the way that we ecologists see the world around us…and it was awesome.
Dr. Jim Estes, a professor at UC Santa Cruz, was one of these movers and shakers. Dr. Estes is perhaps best known for his work on sea otters that provided one of the first and most spectacular examples of how a keystone predator could shape an entire ecosystem. A keystone predator is one that plays a crucial role in the larger community, and whose disappearance has disproportionate and dramatic consequences that cascade throughout the ecosystem in what we call a trophic cascade. (“Trophic” refers to different levels within the food web.)

A pacific northwest ecosystem with and without sea otters. From the recently published Ripple et al. (2014) Science article.
When sea otters disappear from pockets of oceans in the Pacific northwest, the number of sea urchins (which otters love to eat) increases. And sea urchins increase a lot. Without the otters to keep sea urchins in check, the urchins eat up all of the kelp that many fish, crabs, and other underwater sea creatures call home. No otters means no kelp, and no kelp means that a vast array of other underwater sea creatures also disappear.
Otters were recognized as keystone predators back in the 1970’s. But they aren’t the only carnivore that can change the face of an ecosystem. In fact, Dr. Estes presented a “sneak peak” at results from a review paper that he and colleagues were just about to publish in one of the world’s leading scientific journals.
Their article documents that at least seven of the world’s 31 large carnivores have been found to trigger trophic cascades. Some of these effects derive from the fact that big predators reduce herbivores by eating them. But some of these effects are mediated through “fear” — in which prey animals change their behavior to avoid predation. And some of these changes are because top predators suppress smaller predators, which in turn suppress their prey.
There are many, many ways in which top predators shape the face of ecosystems around the world. Furthermore, as Dr. Estes and his colleagues (all “biocelebrities” and many of whom were also at the GRC!) point out in this new paper, these top predator populations are declining. They are declining quickly and globally, and they are declining as a result of human disturbance. What’s worse is that even though we know that these top predators can have enormous influence over the structure and function of natural systems, we don’t really understand the general patterns that underlie their influence. So as they disappear, it’s anyone’s guess as to how our natural places will change.
It’s abundantly and urgently clear from the recent scientific literature and from the thoughts and interests of ecology’s biggest names at last weeks’ conference that we need to understand how top predators shape the natural world. I’m hopeful that our research here at Snapshot Serengeti will continue to provide tiny pieces of the puzzle towards this scientific understanding. Thank you guys for helping us understand how this amazing world works.
No blog posts!
Sorry for the silence, everyone. Craig, Meredith, and I are currently neck deep in the first ever Gordon Research Conference on Predator Prey Interactions.
We are busy trying to sound intelligent and trying not to be too “star struck.” Yes, believe it or not, there are “bio-celebrities.”
Today I’m hosting a break-out session on the role of “fear” in predator-predator coexistence — wish me luck and I’ll tell you all about it next week!
Happy 2014, Snapshot Serengeti!
It’s a new year. Of course, I am in blatant denial about this, since this means time is passing and I haven’t finished all of the things I planned to do in 2013, but the calendar has turned despite my protests.
So happy 2014 everyone! Here’s a few of the awesome photos we’ve collected over the last year. I’m looking forward to collecting newer and better ones in the year to come!

these guys will always be my favorite animals.

well hello.

heehee.

baby!

hi.

As pretty as they are, maybe fewer of these fire photos. The cameras don’t usually do so well…
Happy 2014!
The joys of poster presentation
As Meredith mentioned last week, she, Craig, and I are counting down the days until we head out to sunny California for an academic conference. I am really looking forward to above-zero temperatures. I am rather less enthused about the prospect of presenting a poster. Yes, it is good networking. Yes, I get to personally advertise results from a study that are currently in review at a journal (and hopefully will be published “soon”). Yes, I get to engage with brilliant minds whose research I have read forward, backwards, and sideways. Despite all of that, I’m still not excited.
Poster-ing is perhaps the most awkward component of an academic conference. Academics are not known for their mingling skills. Add to that the inherent awkwardness of having to lurk like an ambush predator by your poster while fellow ever-so-socially-savvy scientists trudge through the narrow aisle ways, trying to sneak non-committal glances at figures and headings without pausing long enough for the poster-presenter to pounce with their “poster spiel.” For the browsers who do stop and study your poster, you have stand there pretending that you aren’t just standing there breathing down their necks while they try to read your poster until they decide that a) this is really interesting and they want to talk to you, or b) phew that was close, they almost got roped into having to talk to you about something they know/care nothing about. Most conferences have figure out that poster sessions are a lot less painful if beer is served.
Working with big, fuzzy animals means that I usually get a pretty decent sized crowd at my posters. About half of those people want to ask me about job opportunities or to tell me about the time that they worked in a wildlife sanctuary and got to hug a lion and do I get to hug lions when I’m working? I once had a pleistocene re-wilding advocate approach me for advice on – no joke – introducing African lions into suburban America. But they aren’t all bad. I’ve met a number of people in poster sessions who have gone on to become respected colleagues and casual friends. I’ve met faculty members whose labs I am now applying to for post-doctoral research positions. And I’ve learned how to condense a 20-page paper into a 2 minute monologue — which is a remarkably handy skill to have.
As much as I gripe and grumble about poster sessions, I know they’re good for me. At least with this one, I’ll be close to the beach!!
Below is a copy of my (draft) poster for the upcoming Gordon Research Conference that a chunk of the Snapshot Serengeti team will be at. It’s mostly on data outside of Snapshot Serengeti, but you might find it interesting nonetheless! (Minor suggestions and typo corrections welcome! I know I still have to add a legend or two…)

At 4 feet by 4 feet, this thing is a beast!
Things are looking up!
I’ve got to echo Margaret’s apology for our sporadic blog posts lately. Things have been a bit hectic for all of us — Dr (!!!) Margaret Kosmala is finishing up her dissertation revisions and moving on to an exciting post-doctoral position at Harvard, our latest addition, Meredith, is finishing up her first semester (finals! ah!), and I’m knee deep in analyses (and snow!).
So,\ please bear with us through the craziness and rest assured that we’ll pick up the blog posts again after the holidays. In the meanwhile, I’ll show you something that got me really excited last week. (Warning: this involves graphs, not cute pictures.)
Last week, I was summarizing some of the Snapshot Serengeti data to present to my committee members. (My committee is the group of faculty members that eventually decide whether my research warrants a PhD, so holding these meetings is always a little nerve-wracking.) As a quick summary, I made this graph of the total number of photographs of the top carnivores. Note that I’m currently only working with data from Seasons 1-3, since we’re having trouble with the timestamps from Seasons 4-6, so the numbers below are about half of what I’ll eventually be able to analyze.
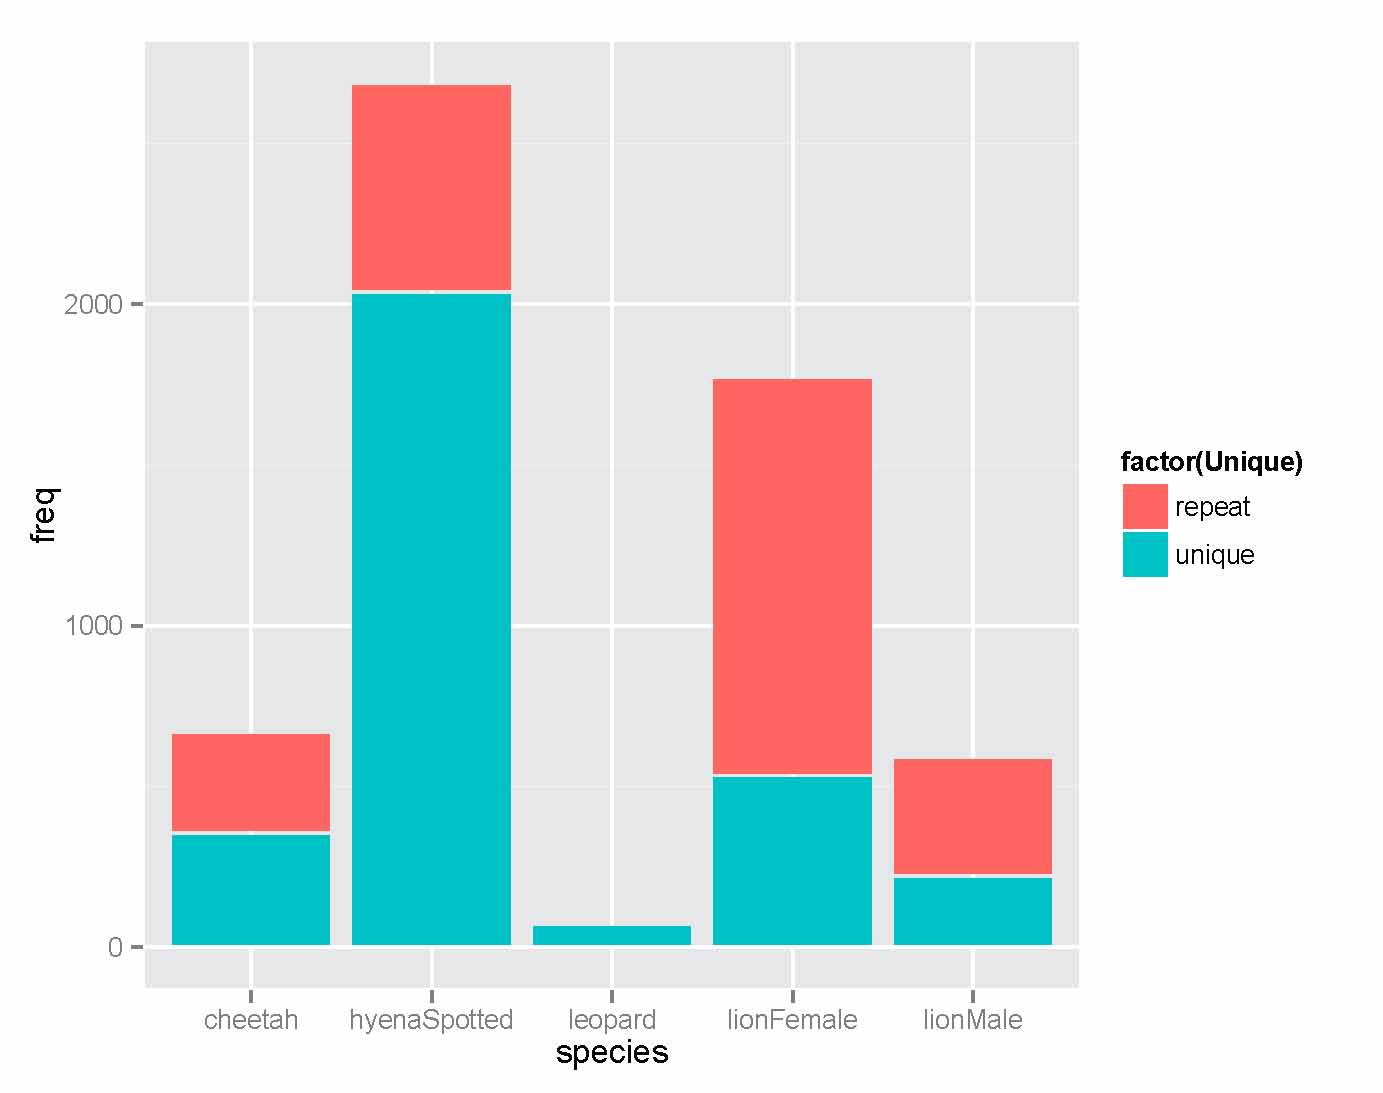
The height of each bar represents the total number of pictures for each species. The color of the bar reflects whether or not a sighting is “unique” or “repeat.” Repeated sightings happen when an animal plops down in front of the camera for a period of time, and we get lots and lots of photos of it. This most likely happens when animals seek out shade to lie in. Notice that lions have wayyyy more repeated sightings percentage-wise than other species. This makes sense — while we do occasionally see cheetahs and hyenas conked out in front of a well-shaded camera, this is a much bigger issue for lions.
I also dived a little deeper into the temporal patterns of activity for each species. The next graph shows the number of unique camera trap captures of each species for every hour of the day. See the huge spike in lion photos from 10am-2pm? It’s weird, right? Lions, like the other carnivores, are mostly nocturnal….so why are there so many photos of them at midday? Well, these photos are almost always lions who have wandered over for a well-shaded naptime snoozing spot. While there are a fair number of cheetahs who seem to do this too, it doesn’t seem to be as big of a deal for hyenas or leopards.
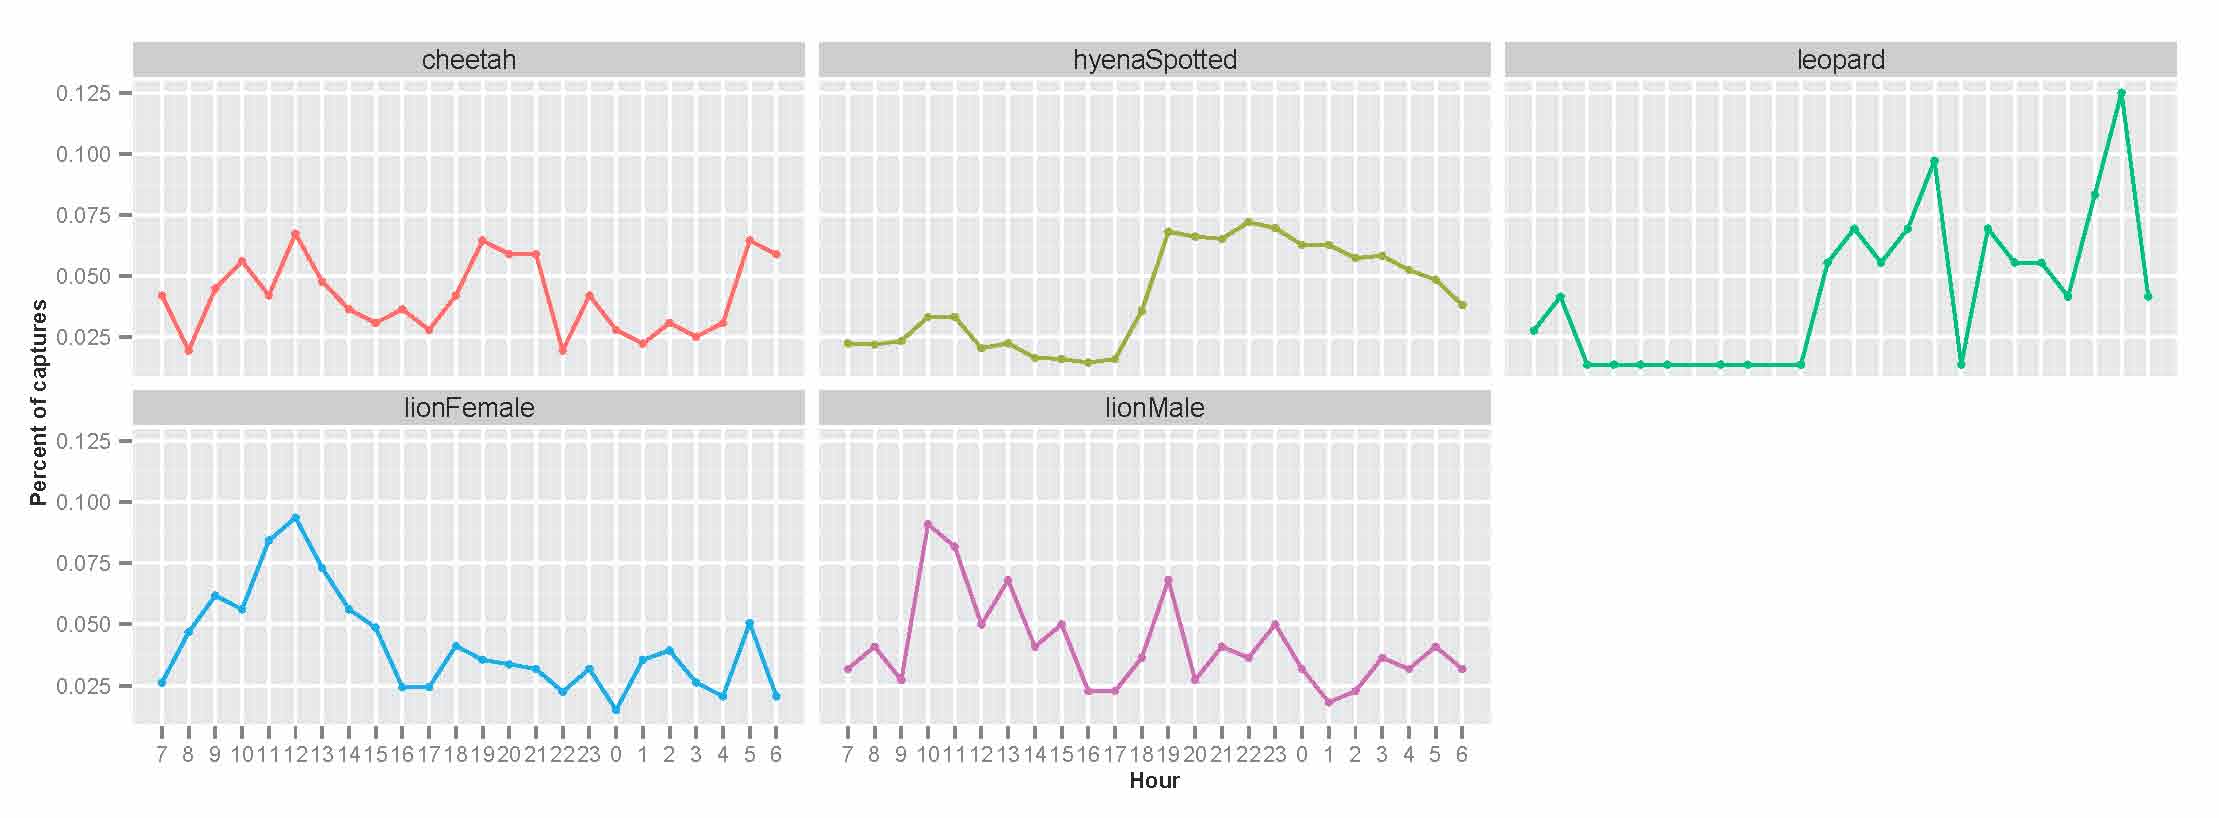
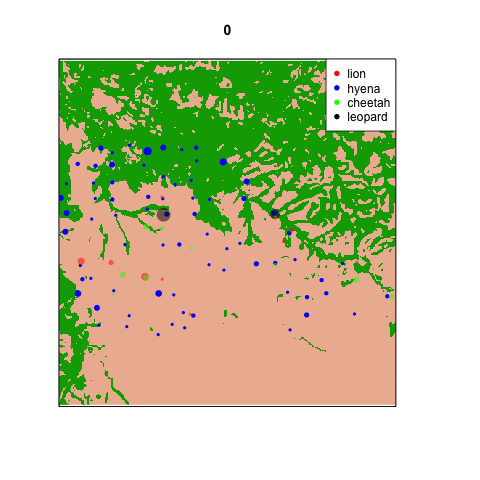
Why is this so exciting? Well, recall how I’ve repeatedly lamented about the way shade biases camera trap captures of lions? Because lions are so drawn to nice, shady trees, we get these camera trap hotspots that don’t match up with our lion radio-collar data. The map below shows lion densities, with highest densities in green, and camera traps in circles. The bigger the circle, the more lions were seen there.

The “lion hotspots” in relatively low density lion areas have been driving me mad all year. These are nice, shady trees that lions are drawn to from up to several kilometers away, and I’ve been struggling to reconcile the lion radio-collar data with the camera trapping data.
What the graphs above suggest, though, is that there likely to be much less bias for hyenas and leopards. Lions are drawn to shade, because they are big and bulky and easily overheated. We see this in the data in the form of many repeated sightings (indicating that lions like to lie down in one spot for hours) and in the “naptime spike” in the timing of camera trap captures that suggest lions seeking out shade trees to go to. Although this remains a bit of an issue for cheetahs, what the graphs above suggest is that using camera traps to understand hyena and leopard activity will be much less biased and much more straightforward — ultimately, much easier than it is for lions. And this is really good news for me.
Analyses galore
Last week I posted an animated GIF of hourly carnivore sightings. To clarify, the map showed patterns of temporal activity across all days over the last 3 years — so the map at 9am shows sites where lions, leopards, cheetahs, and hyenas like to be in general at that time of day (not on any one specific day).
These maps here actually show where the carnivores are on consecutive days and months (the dates are printed across the top). [For whatever reason, the embedded .GIFs hate me; click on the map to open in a new tab and see the animation!]
Keep in mind that in the early days (June-Sept 2010) we didn’t have a whole lot of cameras on the ground, and that the cameras were taken down from Nov 2010-Feb 2011 (so that’s why those maps are empty).

Carnivores captured on any given day across the study area
The day-by-day map is pretty sparse, and in fact looks pretty random. The take-home message for this is that lions, hyenas, cheetahs, and leopards are all *around*, but the chances of them walking past a camera on any given day are kinda low. I’m still trying to find a pattern in the monthly distributions below.

Carnivore captures per month
So this is what I’ve been staring at in my turkey-induced post-Thanksgiving coma. Could be worse!
Let the analyses begin!
Truth be told, I *have* been working on data analysis from the start. It’s actually one of my favorite parts of research — piecing together the story from all the different puzzle pieces that have been collected over the years.
But right now I am knee-deep in taking a closer look at the camera trap data. Since we have *so* many cameras taking pictures every day I want to look at where the animals are not just overall, but from day to day, hour to hour. I’m not 100% sure what analytical approaches are out there, but my first step is to simply visualize the data. What does it look like?
So I’ve started making animations within the statistical programming software R. Here’s one of my first ones (stay tuned over the holidays for more). Each frame represents a different hour on the 24 hour clock: 0 is midnight, 12 is noon, 23 is 11pm, etc. Each dot is sized proportionally to the number of captures of that species at that site at that time of day. The dots are set to be a little transparent so you can see when sites are hotspots for multiple species. [*note: if the .gif isn’t animating for you in the blog, try clicking on it so it opens in a new tab.]
 It’s pretty clear that there are a handful of “naptime hotspots” on the plains. You can bet your boots that those are nice shady trees in the middle of nowhere that the lions really love.
Animals aren’t the only thing that’s cool
Crazy week this week, so I just wanted to post a link to this fascinating and hilarious blog post about plant communication. Yup, you heard right. Animals aren’t the only things that communicate: plants do too! But instead of using sound, plants communicate via chemicals.
First, some plants respond to hungry predators (e.g. bugs, mammalian herbivores) by producing bad-tasting or toxic chemicals that stops would-be-munchers in their tracks — this is called and “induced response” or “induced defense” and is pretty well documented in terrestrial plants. But what’s even cooler is that attacked plants might also release chemical signals to “talk” to neighbors — allowing un-munched-on plants to trigger pre-emptive defenses. Originally known as the “talking trees hypothesis,” this interplant communication was first described in the 1980’s — though more recent research suggests that “eavesdropping” might better capture the true nature of the interaction.

The “talking” seaweed Ascophyllum Nodosum, image from: onlyfoods.net
More recently and perhaps even cooler is that plants not only “talk” to each other, but to other animals! The blog post linked above describes an intertidal plant that basically calls in the predators of its predators. When the plant gets munched on, by, say, a snail, it releases a chemical signal that attracts things that eat snails, like crabs.
Crazy, and awesome. Even though I think I’ll stick with studying big furry things, plants are pretty cool.
What makes a vintage year for the Serengeti lions?
### Today’s blog is an excerpt from Craig Packer’s forthcoming book, “Lions in the Balance: Man-eaters, manes and men with guns”, which will be published by University of Chicago Press in the fall of 2014. ###
When the Italians attempted to conquer Abyssinia in 1887, they provisioned their troops with livestock brought from India, but some of the cattle were infected with the rinderpest virus. By 1897, the disease had spread south from the Ethiopian plateau to South Africa’s Cape of Good Hope and across to West Africa, killing ninety percent of domestic livestock across the entire continent. Control programs were initiated throughout Africa; by the 1960s rinderpest was restricted to only a few areas, and Serengeti was the last major reservoir in Tanzania. A cattle-vaccination program around the Serengeti finally eliminated the disease from the wildlife inside the park in 1963. Liberated from rinderpest, the wildebeest, buffalo, warthog and other ruminant populations grew exponentially until they reached their current plateaus in 1979.
The lion population grew, too, but in a very different pattern.
The lions in the wooded habitat of our study area remained stable from 1966 until 1973 when the population suddenly leapt to a new equilibrium, then remained stable for another ten years before leaping again in 1983. The ruminant population had nearly tripled between 1966 and 1973; what held back the lions for so long? And what happened in 1973 and 1983?
Our lions endure an annual pattern of feast and famine; the migration brings the wildebeest and zebra within easy reach during the rainier months but sends the herds north to Kenya each dry season. In normal years, our study lions struggle to persist on warthog and buffalo, but these only sustain the adults – few cubs manage to survive.
The dry season of 1973 was the rainiest in decades, and the unseasonably green grasses attracted the wildebeest and zebra to our woodlands study area more or less continuously until the normal rains returned in November. Without the usual dry season famine, virtually every cub born in 1973 survived.
These surviving cohorts were large enough to form entirely new prides that could compete successfully against the prevailing social order and redraw the map of lion pride territories. Tough new gangs squeezed their way into the neighborhood, allowing the lion population to finally rise to a higher post-rinderpest plateau.
The recovering herds not only provided more meat on the hoof, but the wildebeest’s insatiable appetite for grass subsequently modified the habitat in the lions’ favor. An awful lot of grass was left uneaten when the wildebeest population was held low by rinderpest: grass fires roared through the park each year, burning the young acacia trees to stumps. But the expanding wildebeest population became the world’s largest lawn service, mowing the grass down to the nubs over thousands of square kilometers – creating fire breaks through much of the park. By the mid-1970s, less than a quarter of the Serengeti burned each year, and saplings were able to grow unhindered. Tree recruitment reached a peak in 1980 and persisted for ten years.
Lions need cover to hunt more successfully, and 1983 was the first year with favorable dry-season rainfall in this new improved world for hunting lions. Once again, the woodland prides recruited large numbers of young – large enough to spawn an expansion of new prides and redraw the map, with more groups packed more tightly than ever before.
The woodlands population crashed during a major disease outbreak in 1994 – lion numbers fell back to levels unseen since the late 1960s. But in 1999 – the first post-outbreak year with favorable dry season rainfall – the woodland population bounced all the way back up to the same level as in 1983-1993.
On the plains, the population’s initial post-rinderpest spurt occurred sometime after George Schaller’s departure in 1969, reaching a new plateau by 1974 when monitoring of the plains prides resumed. The plains population remained unchanged until November 1997, when El Niño brought the heaviest rains in forty years. The grasses on the plains had started growing taller during the early 1990s, and the El Niño floods kept the migration out on the plains for the longest period in decades. A single year with a more consistent food supply was enough to allow the plains lions to spawn whole new prides in the taller grasses.
As Lenin once said, “Sometimes decades pass and nothing happens; and then sometimes weeks pass and decades happen.”
Thanks to the Snapshot Serengeti camera trap grid, we can now watch the migration respond to year-to-year variations in rainfall. The next time the lions have a banner year, we will all be able to witness how food on the hoof translates into a baby boom of lucky cubs.
What does the fox say?
By now, you have probably heard of this silly (but hilarious) video that’s been making the rounds of the interwebs lately:
It’s pretty catchy, not just because it’s ridiculous, but because it’s a pretty good question. I mean, how many of you out there have actually ever heard a fox?
The sounds of the bush are one of the many, many things I miss being back here in civilization. From my slightly sketchy corner of Saint Paul, I hear fire crackers and unmuffled engines roaring. Occasionally I get chattered at by an angry squirrel in the back yard. But that’s about it. Nothing like the otherworldly chorus of the Serengeti savanna that Lucy so beautifully described.
The sounds really are incredible and often unbelievable, and I thought I’d share some of them with you. I couldn’t actually figure out how to upload audio files, so I scoured Youtube for the best audio clips I could find and embedded them as videos here.
Zebras: Nothing like horses, these stripy equids sound something like a braying donkey crossed with a barking dog.
Wildebeest: I believe that somewhere in the annals of Zooniverse blogs, there is an audio or video clip of me doing a wildebeest impression. This is better.
Hyenas: Despite being hell-bent on devouring all of my camera traps, these guys are pretty cool. They have a rather large repertoire of very…unusual…vocalizations that are used to communicate in a number of situations. The whoop, which you hear at 0:05 and 0:55, is a long-distance call often used to rally scattered clan members. The laugh at 2:33 is a sign of nervousness or submission. Similar to human voices, hyena vocalizations are individually recognizable to clan-mates. To learn more about hyena vocalizations, check out this blog by hyena expert and director of Masai Mara’s long-term hyena project, Kay Holekamp.
Lions: And finally, for the best, non-hollywood lion roar, scroll about halfway down through our lion research center’s page. This is what they really sound like.
I’ll take any of these noises over the sounds of the city any day.
