
If you’ve got the time to sit down for 15 minutes and subject yourself to some truly awe-inspiring photography, check out this TED talk from the documentary film-making couple, Beverly and Dereck Joubert as they recount their adventures in Africa interacting with big cats and their big personalities.

Beverly and Dereck Joubert. (Photo Credit: © Wildlife Films Botswana / Mike Meyers)
https://www.ted.com/talks/beverly_dereck_joubert_life_lessons_from_big_cats
A touch of poetry
I’ve been doing a lot of work in Program MARK recently, a software program that enables you to calculate parameters like survival or detectability for animals that are marked and then re-encountered at a later time (I’m trying to see if we can use methods like these on some of the smaller mammals we sight in the camera trap photos). Sounds fun, right? A lot time spent staring at a screen full of numbers, manipulating a parameter here, adding a covariate there, trying to fit more and more appropriate models to the data. Anyhow, I was messing about trying to figure out how to incorporate age-structured temporal variability into my design matrix (don’t worry, I hardly know what all that means either) the other day when I stumbled across something quite delightful — someone has secreted away a small collection of poems about the angst of modeling in the program help files! Statisticians are people after all!
Musings at Midnight
Here I sit before the computer and MARK,
Hoping the circuitry in my brain would spark —
Neurons could fire, light bulbs would flash,
My brain running faster than the 50-yard dash.
And of the billions of models — one of each kind —
H-sub-phi-one-S-slash-t would be the model that I’d find.
Its bias was low, its precision was high,
And no other QAICc was nigh.
Well, back to work. I finish this rhyme,
Having made sure I covaried by writing by time.
Jennifer Ballard.
Biometricians
Vaguely scratching
Numbers wild
Never matching
Counting crows
Or eels electric
Distributions
Parametric?
Badly biased
Or vaguely valid
Significant
Cucumber Salad
Droege, S.
Data from Afar

Earth, rendered from MODIS data
Look at this picture of the world – it’s blue, it’s green, it’s dynamic. It is covered in swirling clouds beneath which we can see hints of landforms, their shapes and their colors. Satellites tireless orbiting the Earth gathered the information to construct this image. And every pixel of this this awe-inspiring rendition of our planetary home is packed with data on geology, topography, climatology, and broad-scale biological processes.
I still find it funny that I can sit in my office and watch weather patterns in Asia, cloud formation over the Pacific, or even examine the contours of the moon in minute detail, thanks to remote sensing programs. Not that lunar geomorphology is particularly pertinent to lion behavior, at least, in any way we’ve discovered so far. Still, an incredible amount of information on the Serengeti landscape can be collected by remote sensing and incorporated into our research. “Remote sensing” simply refers to gathering information from an object without actually making physical contact with the object itself. Primarily, this involves the use of aerial platforms (some kind of satellite or aircraft) carrying sensor technologies that detect and classify objects by means of propagated signals. Most people are passingly familiar with RADAR (“radio detection and ranging”) and SONAR (“sound navigation and ranging”), both examples of remote sensing technologies where radio waves and sound, respectively, are emitted and information retrieved from the signal bouncing back off of other objects. The broad-scale biotic or abiotic environmental information gathered can then be used in our analyses to help predict and explain patterns of interest. People are using remote sensing to monitor monitoring deforestation in Amazon Basin, glacial features in Arctic and Antarctic regions, and processes in coastal and deep oceans. Here are brief vignettes of several kinds of remote sensing data we draw upon for our own biological studies.

Herbivore distributions overlaid on NDVI readings
NDVI: Normalized Difference Vegetation Index
NDVI is collected using the National Oceanic and Atmospheric Administration (NOAA)’s Advanced Very High Resolution Radiometer and is an assessment of whether a bit of landscape in question contains live green vegetation or not. And yes, it’s far more complicated than simply picking out the color “green”. In live plants, chlorophyll in the leaves absorbs solar radiation in the visible light spectrum as a source of energy for the process of photosynthesis. Light in the near-infrared spectral region, however, is much higher in energy and if the plant were to absorb these wavelengths, it would overheat and become damaged. These wavelengths are reflected away. This means that if you look at the spectral readings from vegetation, live green plants appear relatively dark in the visible light spectral area and bright in the near-infrared. You can exploit the strong differences in plant reflectance to determine their distribution in satellite images. Clever, right? NDVI readings are normalized on a scale of -1 to 1, where negative values correspond to water, values closer to zero indicate barren areas of tundra, desert, or barren rock, and increasingly positive values represent increasing vegetated areas. As you can see in the image above, we have NDVI readings for our study sites which can be used to examine temporal and spatial patterns of vegetation cover, biomass, or productivity — factors important in driving herbivore distribution patterns.

Wildfire occurrence data gathered from MODIS satellites
MODIS: Moderate-resolution Imaging Spectroradiometer
The MODIS monitoring system is being carried in orbit aboard a pair of satellites, the Terra and Aqua spacecraft, launched by NASA in the early 2000s. The two instruments image the entire surface of the Earth every 1 to 2 days, collecting measurements on a range of spectral bands and spatial resolutions. Their readings provide information on large-scale global processes, including pretty much anything that can occur in the oceans, on land, or throughout the lower atmosphere. Many of the beautiful Earth images, such as the one at the head of this post, are constructed using MODIS data. We hope to use MODIS information for the detection and mapping of wildlife fires, which impact organisms at every level of the Serengeti food web.

LiDAR: Apparently, a common misnomer is that “LiDAR” is an acronym for Light Detection and Ranging, while the official Oxford English Dictionary (the be-all-end-all for etymology) maintains that the word is merely a combination of light and radar. Either way, it’s less of a mouthful than the other two techniques just discussed!
LiDAR is quite well-known for its applications in homing missiles and weapons ranging, and was used in the 1971 Apollo 15 mission to map the surface of the moon. We also use this for biology, I promise. What LiDAR does, and does far better than RADAR technology, is to calculate distances by illuminating a target with a laser and measuring the amount of time it takes for the reflected signal to return. High resolution maps can be produced detailing heights of objects and structural features of any material that can reflect the laser, including metallic and non-metallic objects, rocks, rain, clouds, and even, get this, single molecules. There are two types of LiDAR: topographic, for mapping land, and bathymetric, which can penetrate water. To acquire these types of data for your site, you load up your sensors into an airplane, helicopter, or drone and use these aerial platforms to cover broad areas of land. I first became aware of LiDAR from a study that used this technology in South Africa to map lion habitat and correlate landscape features with hunting success. I’ve also seen it used to map habitat for wolves and elk, determine canopy structure, and, interestingly enough, to remotely distinguish between different types of fish (weird, and also really neat). Now we don’t have LiDAR information for the Serengeti, so keep an eye out for anyone who might be able to lend us a couple of small aircraft and some very expensive sensing equipment!
Pholidota is in the air…
I hope you kids didn’t get too crazy celebrating the holiday last weekend. It’s so easy to go overboard with the flowers and the chocolates and the small armored African mammals…
Because you all were celebrating WORLD PANGOLIN DAY last Saturday, right? Of course you were. Pangolins! Now, if you don’t know what a pangolin is, you obviously haven’t been looking at enough Snapshot images! Shoo, get back out there and ID some more.
Just kidding, we never really see these guys. This is what they look like:

The one and only awesome pangolin picture our camera traps have ever taken
I have friends living on reserves in South Africa who have only seen on of these guys in there entire life, so it’s neat that we do get to see these guys through out cameras. The pangolin (or “scaly anteater”) is a small insectivorous mammal coated in thick keratinous armored plates. Why would you want to be coated in armor made of finger-nail material? Well, every once in a while it appears to come in handy..
(This video is extremely silly and dramatic. But dang, that is a lot of lions)
Anyhow, I was a little slow on the draw for this one, so we’re going to have wait an entire year for this epic holiday to roll around again. To keep you busy in the meantime, here are some neat pangolin videos for your enjoyment:
Have you watched your television lately?
As I happen to be an impressionable first year student, many of my introductory courses are focused on molding us younglings not only into insightful and profound scientific geniuses, but also on instilling within us a sense of scientific responsibility, particularly when it comes to sharing our work with others. It’s important to be able to convey how freakin’ awesome the research that we do is to people outside of science, which can be really hard when our most exciting result happens to be a string of numbers that popped out of an evil-looking matrix swimming in a sea incomprehensible code.
Most of what we cover in these types of classes is science writing – and there are true gems out there, people with a real talent for sitting down with a biologist who only talks in “ontology” and “heteroscedasticity” and translate all that jargon into an informative, enjoyable piece of literature. You can pick up these pieces in a variety of places – newspapers like The New York Times can have very comprehensive science news articles. Peruse the magazine rack of any book store and, although you may have to dig behind the “Cosmo”, there are popular science magazines covering every disciple under the sun (and beyond!). You’ve already entered the blogosphere, where very passionate people are writing about the discoveries they and others make and the questions, queries, and quandaries still to be explored. Shout out to two of my favorites bloggers – after all of us here at Snapshot Serengeti, of course – Carl Zimmer and Ed Yong, who discourse on all sorts of topics over at National Geographic. And I won’t even start on the wealth of science literature, because I actually do have some stats to run and if I get sucked into this, we’ll be here all night.
I think, however, that one of the most easily accessible types of science dissemination, and the kind likely to reach the further-ranging audience (I know I’m always the only B&N browser with my face in the latest issue of “Scientific American”), is television. Now sure, there is a LOT of bad television out there, I think it goes without saying. Even some purported “educational” channels are going a bit off the deep end (case in point: Animal Planet and their mermaid “documentaries”). But when you’ve just dragged yourself home from a long day in the office and can’t bring yourself to pick up your latest science tome, flip on the tube, find a documentary, and learn a little something.
Particularly for kids and young people, science television is an important inspirational medium. As corny as it sounds, Bill Nye the Science Guy was HIGHLY instrumental in my own scientific development (I still watch an episode every now and again to remind myself that “science rules!”). This type of television shares not only information, but conveys enthusiasm about science, humanizing and breaking down topics which people may have considered beyond their understanding. Speaking of Bill Nye and his science outreach, did people watch his debate with Creationist Ken Ham the other week? It was streamed live by 520,000 people and subsequently downloaded by over a million. Talk about far-reaching, and being picked up by an audience that wasn’t necessarily science-inclined.
Another aspect of science television (and I’m starting to sound a bit like a TV junkie at this point, aren’t I?) that was important to me at least was exposure to fantastic places and creatures. I’m probably not making it to Madagascar anytime soon – are you? But we can learn all about the bizarre and beautiful endemic wildlife, courtesy of everyone’s favorite Sir David Attenborough. I feel like I can practically use ‘Attenborough’ as a synonym for ‘nature documentary’. And remember the sensation when BBC came out with ‘Planet Earth’? Or ‘Life’? Or ‘Human Planet’? You can find them on the channels, you can find them on the internet. Always a winner are the PBS NOVA specials — be sure to scroll down and check out “Poop-Eating Sloth Moths,” because you know you want to. Also, it’s a neat new discovery about a highly entwined natural system. Would have known otherwise? And when you exhaust all those links, here’s another 300 “mind-expanding” documentaries for your enjoyment: http://www.diygenius.com/mind-expanding-documentaries/
So veg out and watch some science!
The Bug-Hunters
As you can see, our primary research involves the big stuff: large carnivores, giant antelope, ungulates that could run you down. The camera trap grid is set up to record the movement patterns of these organisms… Which isn’t to say that other types of creatures which traverse the Serengeti don’t get captured in the net as well. I’m sure that many of you who actively identify have spotted the occasional bird, sighted a wildcat, or perhaps even happened upon a basking reptile. Spatial and temporal data is being gathered on these guys too, and for a small side project, I decided to delve into some of the less well-explored information.
I’m tackling a particular guild of small mammals. The questions I’m asking involve occupancy patterns and coexistence among organisms that compete for a common resource — sort of like that Ali does with large carnivores, but applied to other groups. Right now, I’m looking at data on spatial partitioning among myrmecophagous (there’s your buzzword for the day) animals: animals that eat ants and termites. The Serengeti landscape is littered with termite mounds – giant mud constructions held together by termite spit and seething with social insects. Termites are highly important to serengeti ecosystem functioning, breaking down dead plant matter and churning soil. Furthermore, they form over 80% of the diets of three mammals, the aardwolf (Proteles cristata), the bat-eared fox (Otocyon megalotis), and the aardvark (Orycteropus afer). Let’s meet them, shall we?

The Aardwolf:
Sometimes I still can’t manage to convince even other scientists in our department that I’m not making the aardwolf up. Not an wolf (not an “aard” either), looking suspiciously like some sort of pygmy hyena, and eating primarily insects. I’m sure you can see my problem. Well, at least it is in the hyena family – one of the smallest, coming in at a very slender 7-10 kg. These guys produce saliva that is particularly sticky for licking up ants and termites off of the soil surface. While they can’t break into the giant termite mounds, they are the only African ant-eater to be able to tolerate the chemical defense secretions of the Trinervitermes termite soldier cast.
Best true fact about aardwolves: Aardwolves apparently “roar” when chasing off intruders. Kind of adorable right? Don’t melt too much: if that doesn’t work, they proceed to emit foul-smelling liquid from their anal glands. Delightful.

The Bat-eared fox:
These guys are the only canid to have given up almost entirely on mammals to prey on insects. Although small (only 2-5 kg), a bat-eared fox can scarf up over one million termites per year. In fact, they don’t even need to drink because they fulfill the majority of their water intake needs from all of the insects they consume.
Best true fact about bat-eared foxed: Their ears are sensitive enough toe detect the sound of termites chewing on grass, or, better yet, hear beetle larvae chewing their way out of an underground ball of dung.

The Aardvark:
Definitely the heftiest member of the bunch, at twice the weight of a labrador retriever even though they only stand about 2 feet tall. These guys are solitary and nocturnal, shuffling around at night in search of termite mounds which they tear open with their powerful digging claws. The fox and the aardwolf are unable to break through the thick crust of dirt, and there are intriguing reports of these other guild members trailing aardvarks during seasons when termites are most scarce – perhaps hoping to snatch up some of the termite-crumbs? Having breached a nest, the aardvark slobbers up hundreds and hundreds of insects with its 12 inch tongue. Rather than masticating this mouthful with its teeth, grinds up the ants using the powerful muscles of its gizzard. They’re the sole surviving representative of an obscure mammalian order called the “Tubulidentata” — everyone else in the order kicked the bucket before the end of the Pleistocene.
Best true fact about aardvarks: Although their diet contains mostly ants and termites, they are known to consume a fruit charming called an “aardvark cucumber”.
The diets of all these creatures is composed of exactly the same resource, which can become limiting during particular times of year. No information yet on what kind of partitioning we may find – do the bigger guild members exclude the smaller ones? Is there commensalism (a relationship where one member benefits without affecting the other) between aardvarks and the other mammals? Are some members forced to forage during times when predators are most active?
Representing Science in a Different Way
Several years ago, the prolific science blogger Carl Zimmer (of National Geographic, Discover Magazine, and really any place worth going to for good science writing), published a book called “Science Ink” – a compendium of the artwork various researchers have had immortalized on their skin to show off their devotion to their field of choice:

“Body art meets popular science in this elegant, mind-blowing collection, written by renowned science writer Carl Zimmer. This fascinating book showcases hundreds of eye-catching tattoos that pay tribute to various scientific disciplines, from evolutionary biology and neuroscience to mathematics and astrophysics, and reveals the stories of the individuals who chose to inscribe their obsessions in their skin. Best of all, each tattoo provides a leaping-off point for bestselling essayist and lecturer Zimmer to reflect on the science in question, whether it’s the importance of an image of Darwin’s finches or the significance of the uranium atom inked into the chest of a young radiologist.”
Science inspires me more than anything else (it would have to, or grad school would definitely be off the table!), and besides the sweat, blood, and tears normally dedicated to this pursuit, I believe that body art is a beautiful medium for celebrating this passion.
I got my first tattoo too late to be included in Zimmer’s book (alas! alack!), but did make it onto his National Geographic blog with this beautiful line-drawing of a Dicranurus trilobite.

As I say on the website (click image for the link), I was inspired to fossil-hunt as a young child by my geologist parents and had, in all seriousness, the best trilobite collection of any six year old in northern United States. Trilobites, for the unfamiliar, are not aliens – despite all appearances to the contrary. They were one of the most prolific arthropods in all of evolutionary history, ranging from the mundane and button-looking to the highly ornamented creature crawling between my shoulder-blades. Their evolutionary history and biology is fascinating (their eyes, for example, are made of calcite – a kind of mineral!), and I highly recommend Richard Fortey’s book, “Trilobite!”, for anyone wanting to learn more.
Continuing to mine the fossil vein, my second tattoo features an allosaurus in the classic preserved “death pose” – not to be confused, of course, with “death throes”. The thrown back head and gaping mouth arise after death as the body of the organism dries and is shuffled around by its environment.

Adoring my other ankle is a tattoo I see fairly commonly among biologists, in particular, evolutionary scientists. Anyone recognize this image?
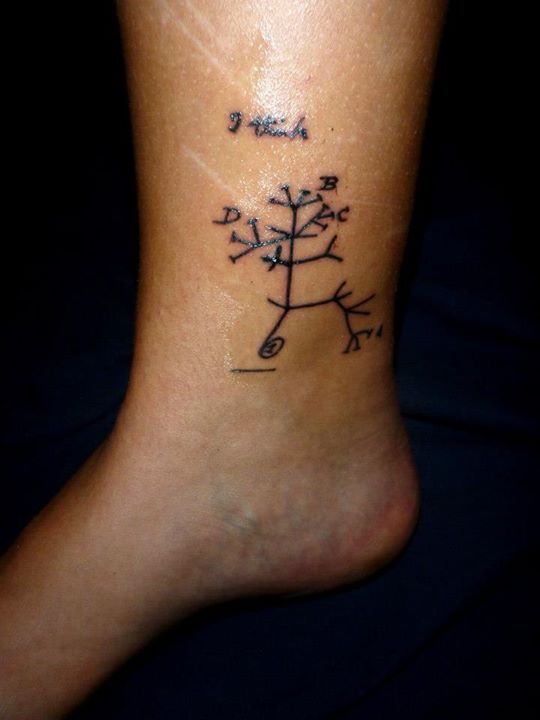
This is the first sketch Darwin ever made of a ‘tree of life’ – the first depiction of his great idea that we could have all evolved from a single common ancestor. Really, the beginning of biology as we know it today. Most poetic and moving, for me at least, is the line he scrawled above his figure: “I think…”
I bring all this up because yesterday I completed a second sitting for my newest science tattoo. It’s all red and healing and kind of sore right now, but hopefully I should have pictures to show soon! A homage to the birthplace of evolutionary ideas — to be revealed at another time.
And now for something completely different…
Now, I’m fairly certain that you guys enjoy looking at a nice critter picture or two. Or three. Or a hundred. (Looking over the Zooniverse stats for membership and ID counts is always a humbling and awe-inspiring experience!) To mix it up a bit, and to give you all a better feel for the scientific background I am coming from, here is a taste of what I experienced during my last job before starting graduate school. I worked for the USGS on the Pacific island of Guam, conducting research on the invasive and highly destructive Brown tree snake (Boiga irregularis).
Guam!

- Photo Credit: Meredith S. Palmer
For those of you who aren’t familiar with this case study, the island of Guam was invaded in the 1960s by what was most likely a single pregnant female Boiga. Over the course of the next few decades, this generalist predator caused the extirpation of almost all native forest bird species, destroyed all nesting seabird populations, led to the extinction of 2/3s of the native mammalian life, and contributed to drastic declines and loss of native reptile and amphibian populations. This situation is highly unique in that it was the first (and remains one of the only) situations in which an invasive reptile caused such a degree of ecological damage. There is currently a higher density of Boiga on Guam – 13,000 per square mile – than there is of all combined snake species in the Amazon basin. Snake populations continue to be sustained on invasive skinks and pose not only severe ecological threats to Guam and surrounding islands, but also cost the island economy millions of dollars per year through losses relating to power outages caused by snakes, snake bite hospitalizations, decline in tourism money, the costs involved with ensuring that snakes do not leave the island, and agricultural losses.
Brown tree snake munching on an invasive gecko species

Photo Credit: Bjorn Lardner
A few of the species still on island, including a mangrove monitor, the moth skink, the highly endangered Mariana fruit bat (attempting to nest, apparently, in my hair), and another native skink species, the blue-tailed skink.

Photo Credit Meredith S. Palmer
While the island itself is beautiful, due to the snake, it was completely depauperate of animal life. It is a Twilight Zone experience to walk through a forest devoid of any natural sounds, without crickets chirping or birds calling. The real beauty and biodiversity of Guam lies underwater, in the coral reefs and shallow oceans that surrounding the island – a place I would retreat to often.
The ocean’s vertebrate life (the massive pink object on the left is a dead sperm whale which snagged up on the reef half a mile off-shore)
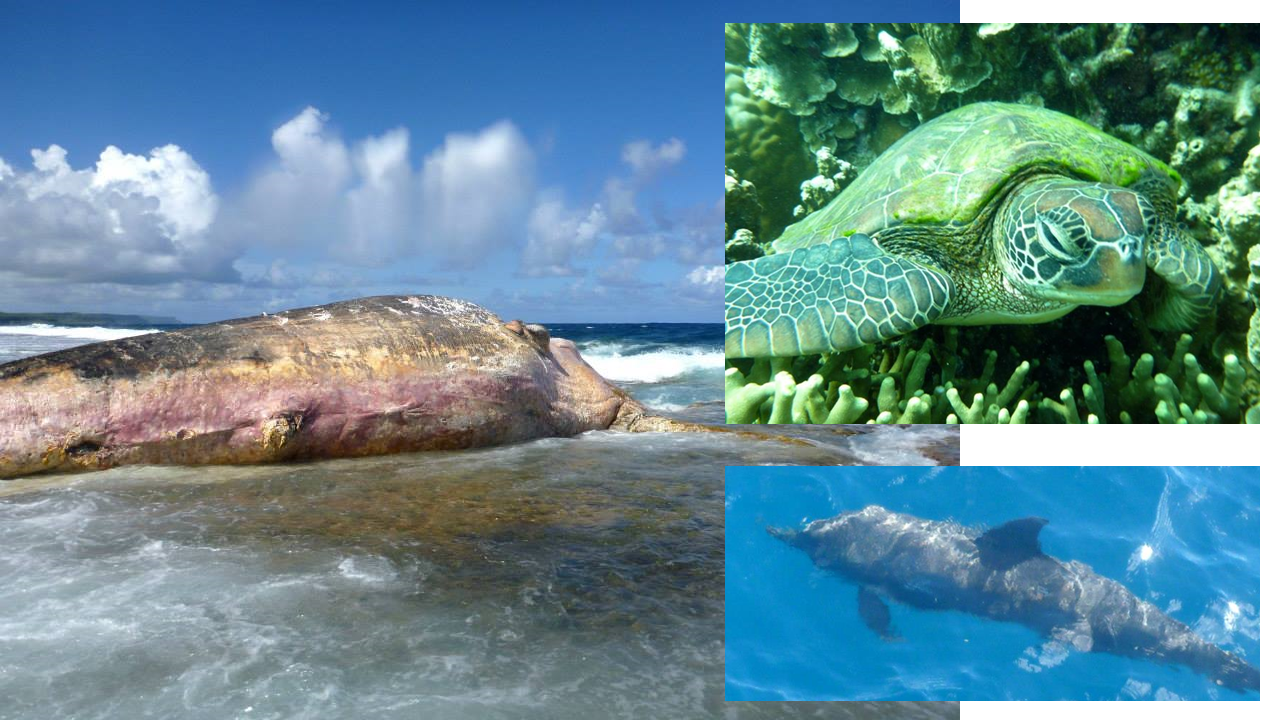
Photo Credit: Meredith S. Palmer
The tropical fish diversity in Guam was absolutely mind-boggling. In addition, nothing would liven up a good snorkel like running into a ferocious eel or a encountering one of these enchanting sharks.

Photo Credit: Meredith S. Palmer
But everybody knows that invertebrates are really where it’s at. Cephalopods!

Photo Credit: Meredith S. Palmer
If anyone has questions about the snakes or invasive species situation on Guam, please feel free to ask. I can also highly recommend the USGS Brown tree snake lab website (http://www.fort.usgs.gov/resources/education/bts/) and the excellent book, “And No Birds Sing”, by Mark Jaffe, which documents the process by which scientists discovered the culprit behind these rapid extinctions.
Conferences and Mind Fodder
It’s a surreal experience, sipping your breakfast coffee at a table where some of the most brilliant minds in ecology are chowing down on sausage and eggs while gleefully recounting scandals in Canadian politics (there are, apparently, a number of these). No matter how many conferences I attend, I am always a bit shocked to discover that generators of fundamental theorems, the authors of Science papers and the case studies in my textbooks are actual flesh-and-blood human beings. People with personalities and foibles, but also scientific minds that, unlike their journal articles, offer the opportunity for interaction and discussion. At the Predator-Prey Interactions conference this last week, there were plenty of brains for me to pick and researchers for me to pester – they put up with it rather well, and the experience offered my great insight into where the field is going and how to tackle the next big ideas in fear and the indirect impacts of predation.

Above is a copy of the poster I presented: I may have described it to someone as containing “idea vomit.” So, I’m going to have to work on that phrasing, but essentially what it contains is a splurge of all of the questions I want to answer, variables I think I worth investigating, and the methodologies at my disposal that could be used to dig down into the core of these issues. Over the course of the week, with its deluge of presentations, posters, workshops, meetings, and the occasional poolside chat, this splurge became refined into a more coherent and plausible set of research objectives.
Okay, so, that may be a bit of a wistful exaggeration. What actually happened is that I received a million suggestions, compiled a list of literature to read that will keep me busy for the next few months, and met a number of interested and informed people who will certainly be useful resources as my research progresses.
Great ideas for the course of my research certainly did come out of this conference. Our system has the major advantage, of course, of the massive camera trap grid and the extensive duration over which the project has been running – no one else has this quantity of information. As you can see on my poster, I can use this data to map out the distributions of herbivores on different time scales and then overlay features (here, a “greenness” index of vegetation) to get an idea of what is attracting or repelling herbivores to different places at different times. This method is extremely useful and often employed by people constructing landscapes of predation risk. However – something that would be informative to do, I learned, would be to ask the animals themselves exactly where they feel safest or most as risk. I don’t mean passing out surveys, but I certainly became excited about incorporating a larger manipulative element to my study.
I had already planned on blasting predator calls around camera traps to see who responds (flees!) and how long it takes for their fear response to go extinct. We can look at this over the long-term using the camera traps. Now, in addition to playing predator calls, I am also interested in obtaining alarm calls from a variety of herbivores to broadcast, which may also shed light on coexistence mechanisms for different herbivore species. If anyone knows where I might be able to snag some audio recordings, let me know!
Another methodology to utilize would be examining “giving up densities” (GUDs). To determine a GUD, feeding trays are set up in different areas around the study site containing food (delicious) mixed into an inedible substrate (like corn cobs, or chunks of PVC piping). The idea is that initially, it’s fairly easy to extract food from the matrix when there’s a lot of it, but over time, you get less and less food return for grubbing around in the PVC. If you don’t feel safe in a particular location AND you’re not extracting enough food to make it worth your while, you should give up and move along sooner than if you were more comfortable in a safer area. The amount of food left in the tray can be measured – this is the GUD. A lower GUD means that less food was left and the animal perceived the area in which it was eating as less risky. This idea was championed by Joel Brown and Burt Kotler, who have used it extensively in rodent systems and impalas.
It sounds like it can be more than a bit tricky to implement some of these manipulations, but that’s what pilot studies are for, right? Right. Until then, back to the literature…
